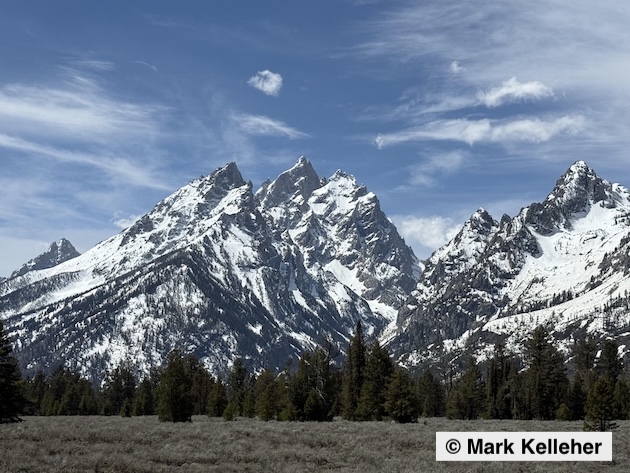
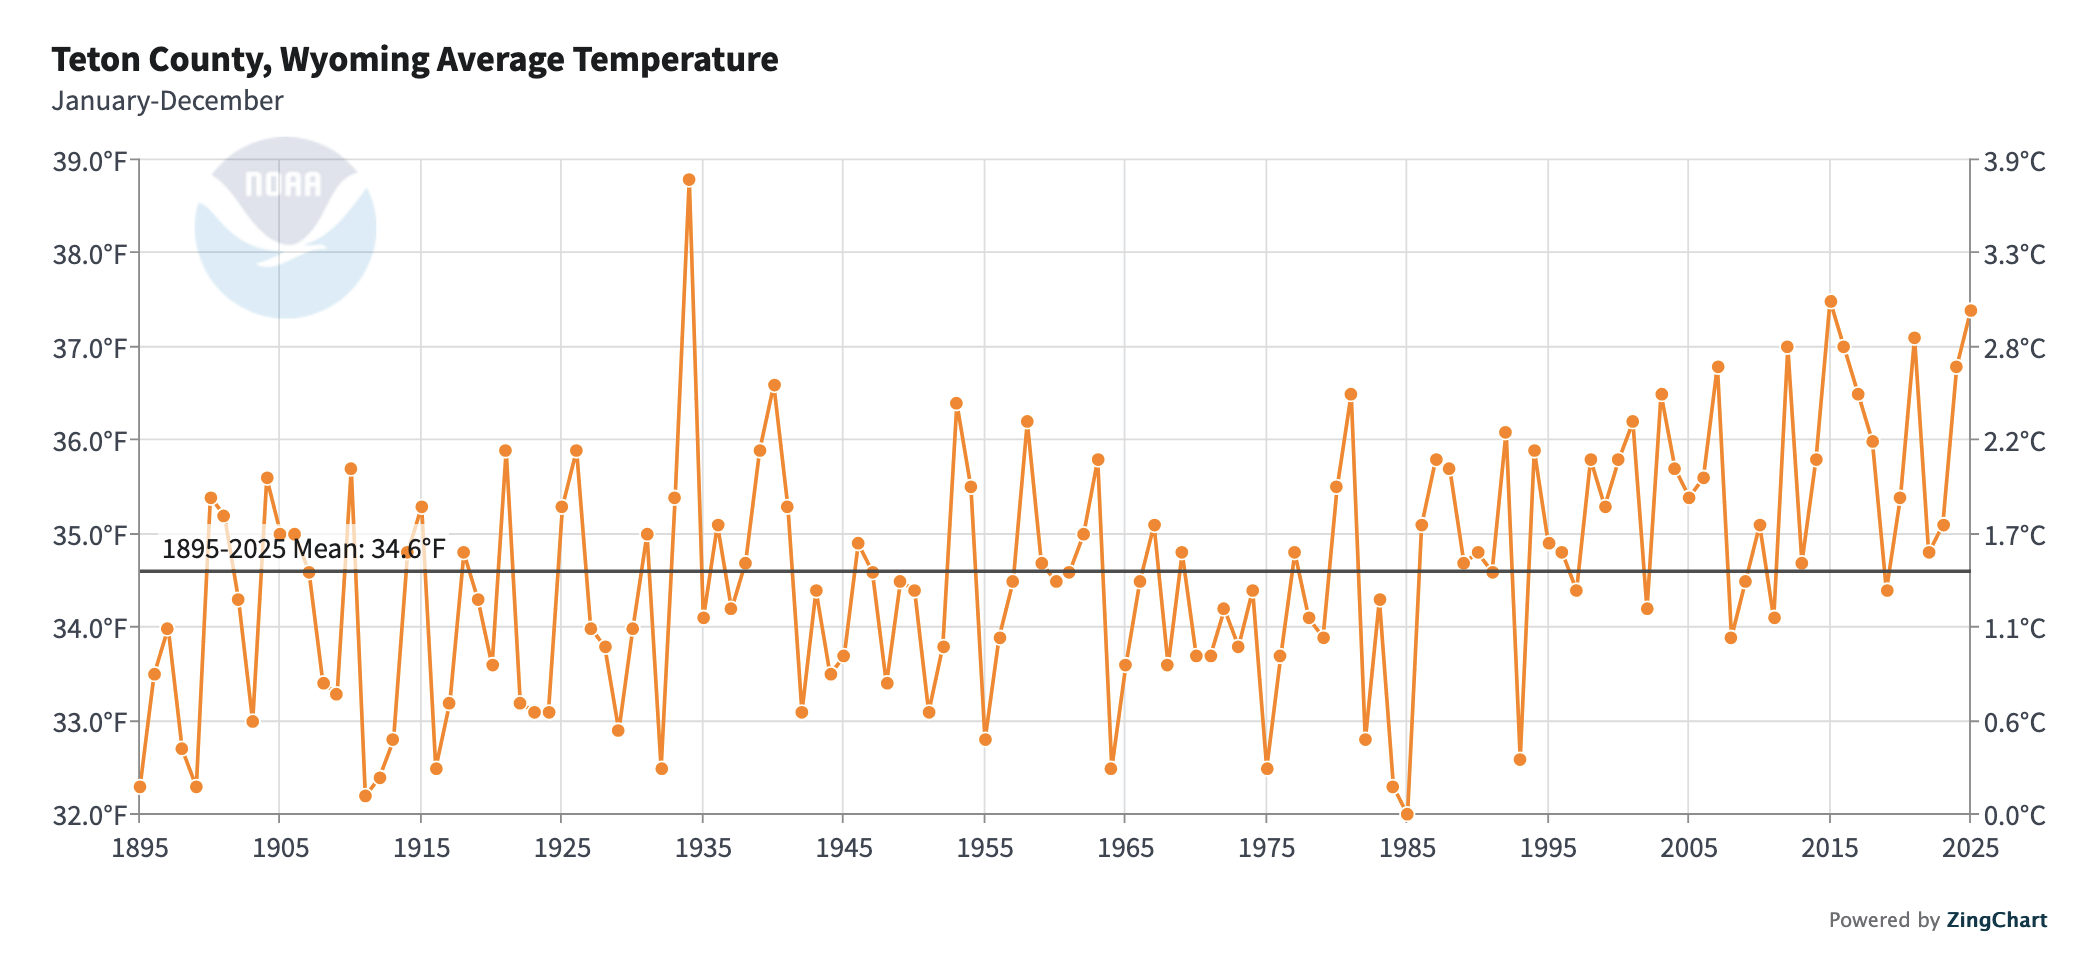
I received an email asking me about a graph of Teton County, WY temperatures that appeared in an article from High Country News. The email was inquiring as to whether it matched the actual data from our local weather stations.
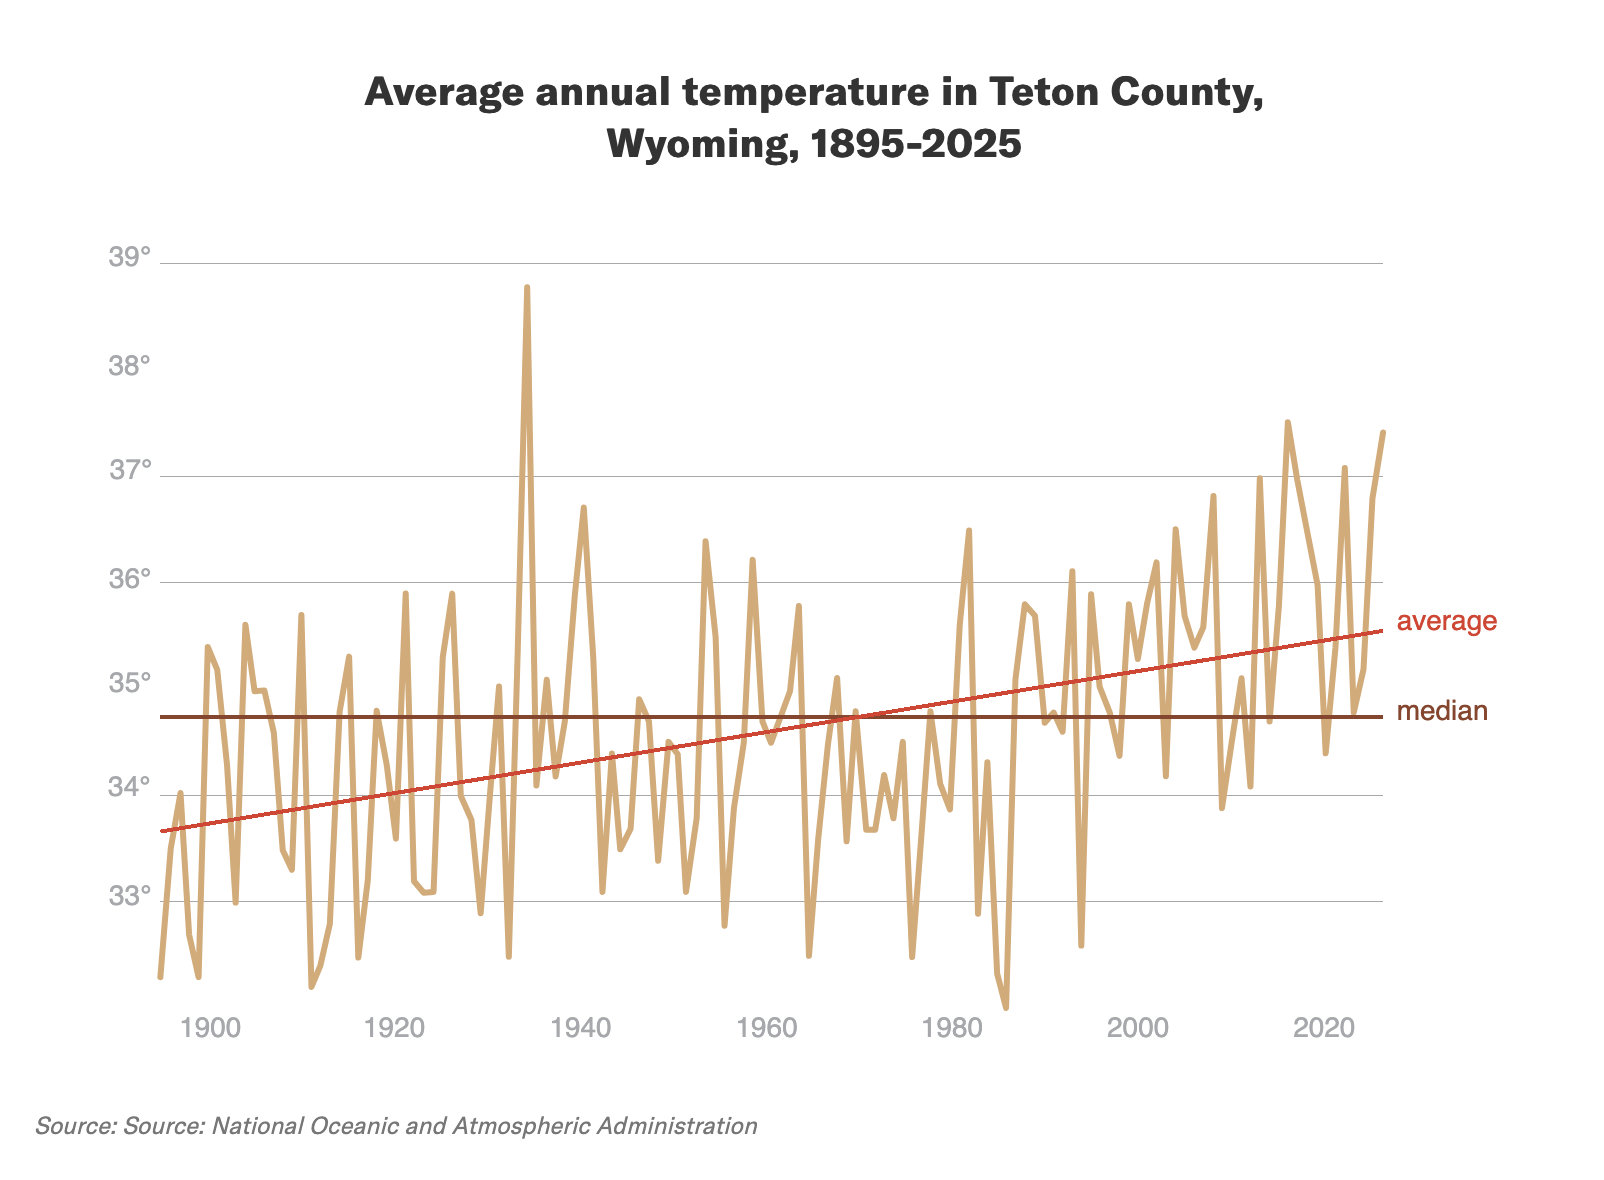
After briefly studying the graph (seen below), I realized that it was constructed from what I will call contrived data. Call it manipulated, manufactured, aggregated, homogenized, or whatever term you like, but it is not an honest representation of the actual data from the official weather observing stations in our region.
The first thing that jumped out at me was the graph shows data going all the way back to 1895. Fact is: there isn’t a single COOP weather station in Teton County Wyoming that has any weather observations prior to 1905!
The data displayed in the graph above from NOAA, for average annual temperatures, does not coincide with the actual data from the long-term records from the Cooperative Weather Observing Stations (COOP) located throughout Teton County.
All of our local weather stations are missing entire months or even years of data, especially prior to the 1950’s. Those years should not be included on the graph, because you would be unable to calculate a truly representative annual mean temperature.
Somehow, NOAA seems to be able to fill in the blanks, regardless of not having any real data to work with. I will explain how they do that bit of hoc-us-pocus at the end of this post.
A couple of other notes on the above graph: 1) The red “average” line that was added to the NOAA graph is not an average line, but rather a linear “trend” line. The “median” line shown would be dividing the data set in half, with half of the numbers (years of data) falling below that line and half of them above that line.
A true representation of the average (or the “mean”) temperature for the whole time period would actually be 34.6 degrees. (I’ll provide that plot at the end of this post).
What follows here in this post are plots made from the raw data for the COOP weather stations in Teton County, WY, with some notes about each weather station’s instrumentation.
The Real Data
There are 5 COOP weather stations within Teton County, WY that have longer-term weather records, which are relatively consistent…. Jackson, Moose, Moran, Snake River, & Alta, WY.
There are three other COOP stations within the county… Darwin Ranch, Old Faithful, and Lake Yellowstone, not included here. Darwin’s records only go back as far as 1975. Old Faithful’s weather records prior to 1988 are essentially nonexistent. Lake Yellowstone’s records date back to 1905, but are very sporadic with huge gaps of missing years over the past 120 years.
I will provide the actual data for each of the five main COOP stations, so you can see the contrast between the real temperature observations reported to the NWS from these stations, and the data that you can retrieve from NOAA’s Climate website.
I chose a maximum of 30 missing days in a year as the threshold for calculating as accurately as possible the annual mean temperature. If any year was missing more than 30 days of observations, then it was excluded from the plot.
In other words, any given year that made the cut, could still be missing an entire month’s worth of data. In those cases, if the majority of missing days were in winter months, that year could have a warm bias. If the majority of missing days were in summer months, that year could have a cold bias.
Each station’s data will be displayed below in a graph, with a 5-year running mean (black line) overlay. Take that with a grain of salt for stations that have long stretches of missing years of data.
To see how many missing days there were for each year, I have provided a link to PDF’s for each station that contains a table of the missing days count for each year.
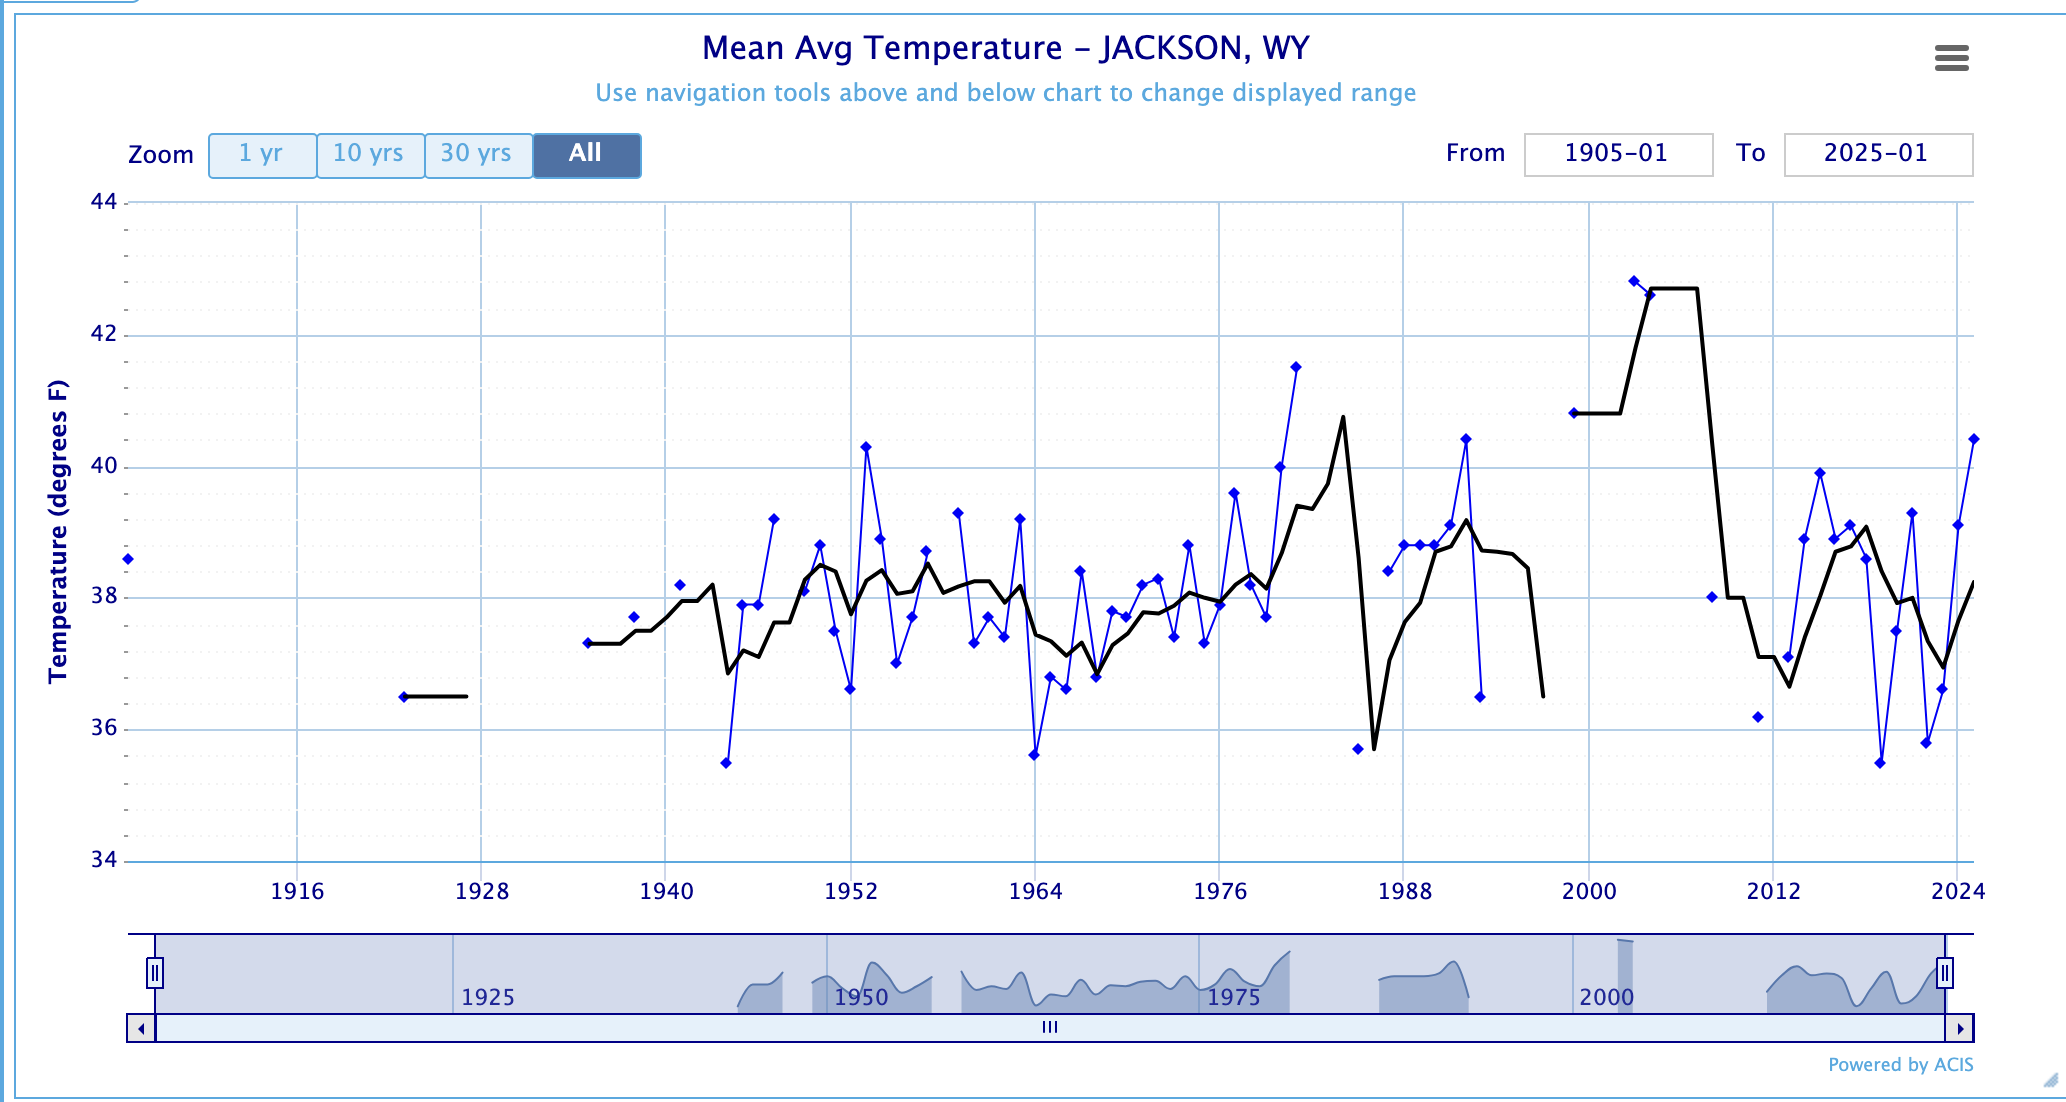
1) Jackson, WY Mean Annual Temperature graph:
Jackson’s earliest year with complete data is 1905, with a huge gap after that until the late 1930’s and into the 1940’s, and many other missing years after that in the 1990’s to early 2000’s. Jackson used Liquid-in-Glass (LIG) thermometers for daily readings until March 2002, when it changed to digital (MMTS).

Link to PDF of data: JACKSON
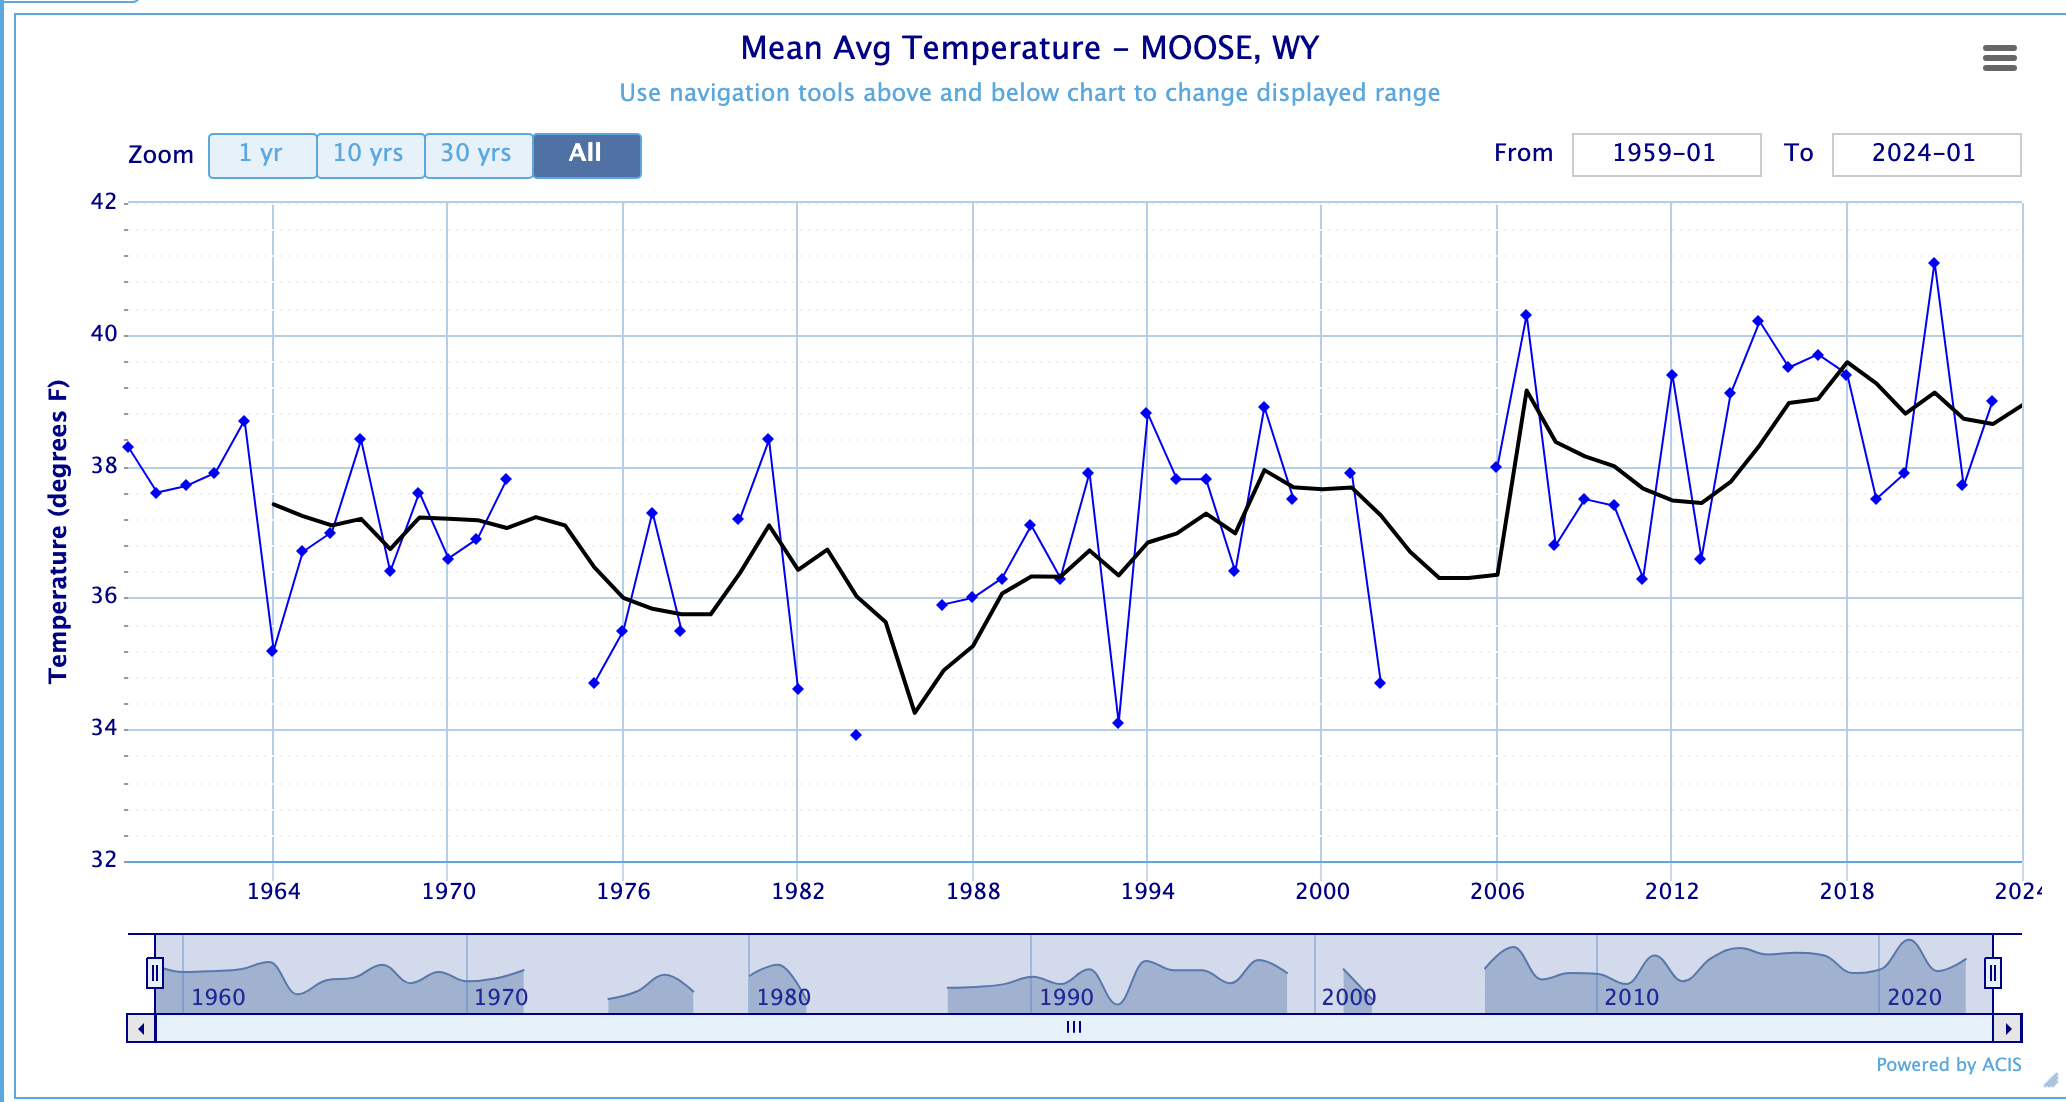
2) Moose, WY Mean Annual Temperature graph:
Moose data only goes back to 1959. Prior to that, from 1935 to 1959, the COOP station was located at Beaver Creek, near the Taggart Lake Trailhead. The Moose station moved short distances several times after 1959, until it was relocated to near the new Visitor Center in July 2018. It was at that time that the station switched from LIG to digital thermometers. The Moose weather station stopped taking temperature readings in early 2024 due to technical problems with the new instrumentation (Nimbus).
You can read more about the Moose station’s thermometer issues in a previous blog post: Temperatures & Thermometers
Link to PDF of data: MOOSE
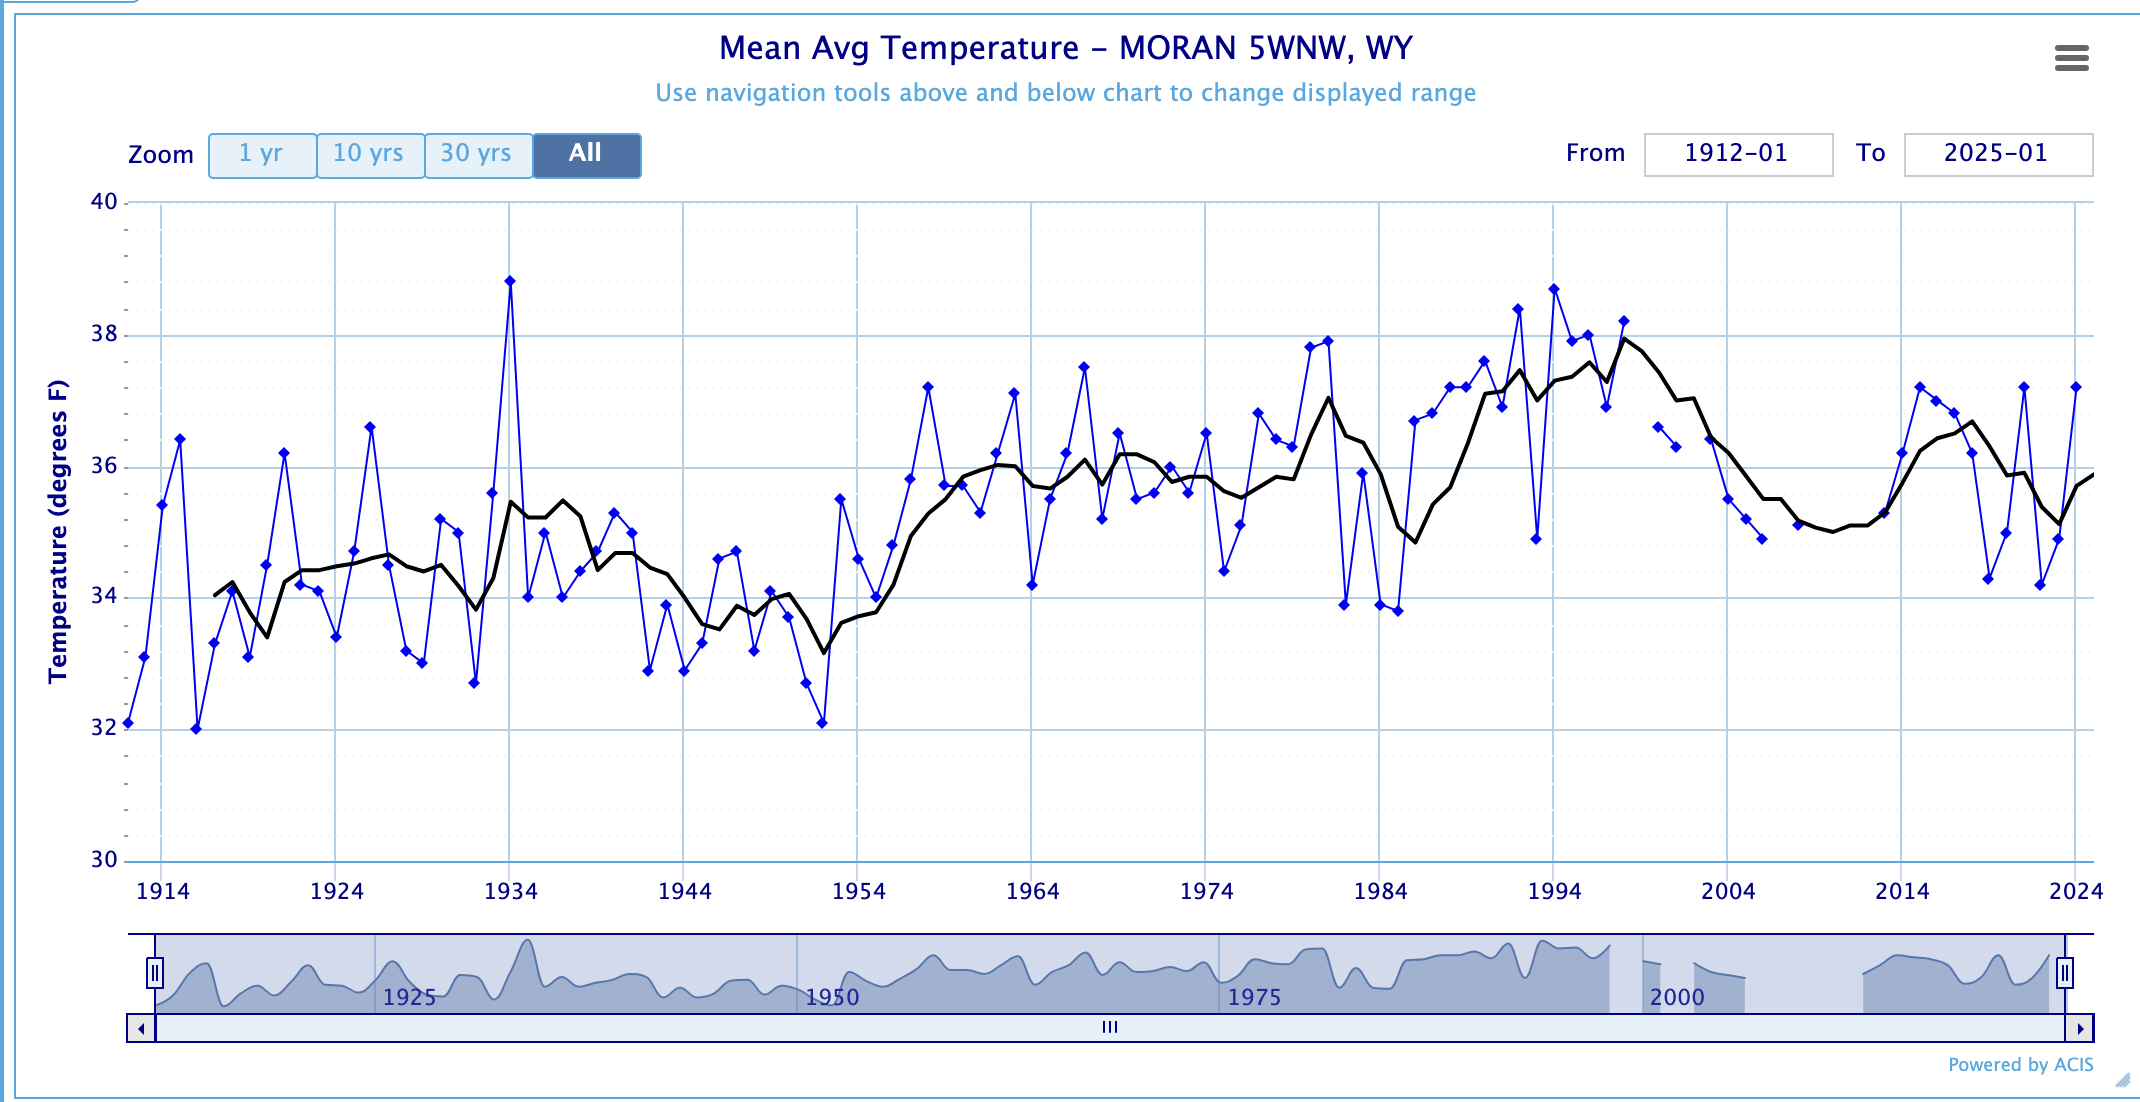
3) Moran, WY Mean Annual Temperature graph:
Moran has the most continuous temperature record in Teton County, dating back to 1914. Unfortunately, its location was moved in 1954, from an open area near river level, to higher ground in a more wooded area. The biggest effect this had was on raising the overnight low temperatures. But, you can still see the jump on the annual average temperature graph that occurred in the mid-50’s, with temps relatively steady after that. Moran used LIG thermometers until May 1999, then switched to digital.
You can read more about Moran’s other thermometer issues in a previous Blog post:
Teton Park nights are warmer…

Link to PDF of data: MORAN
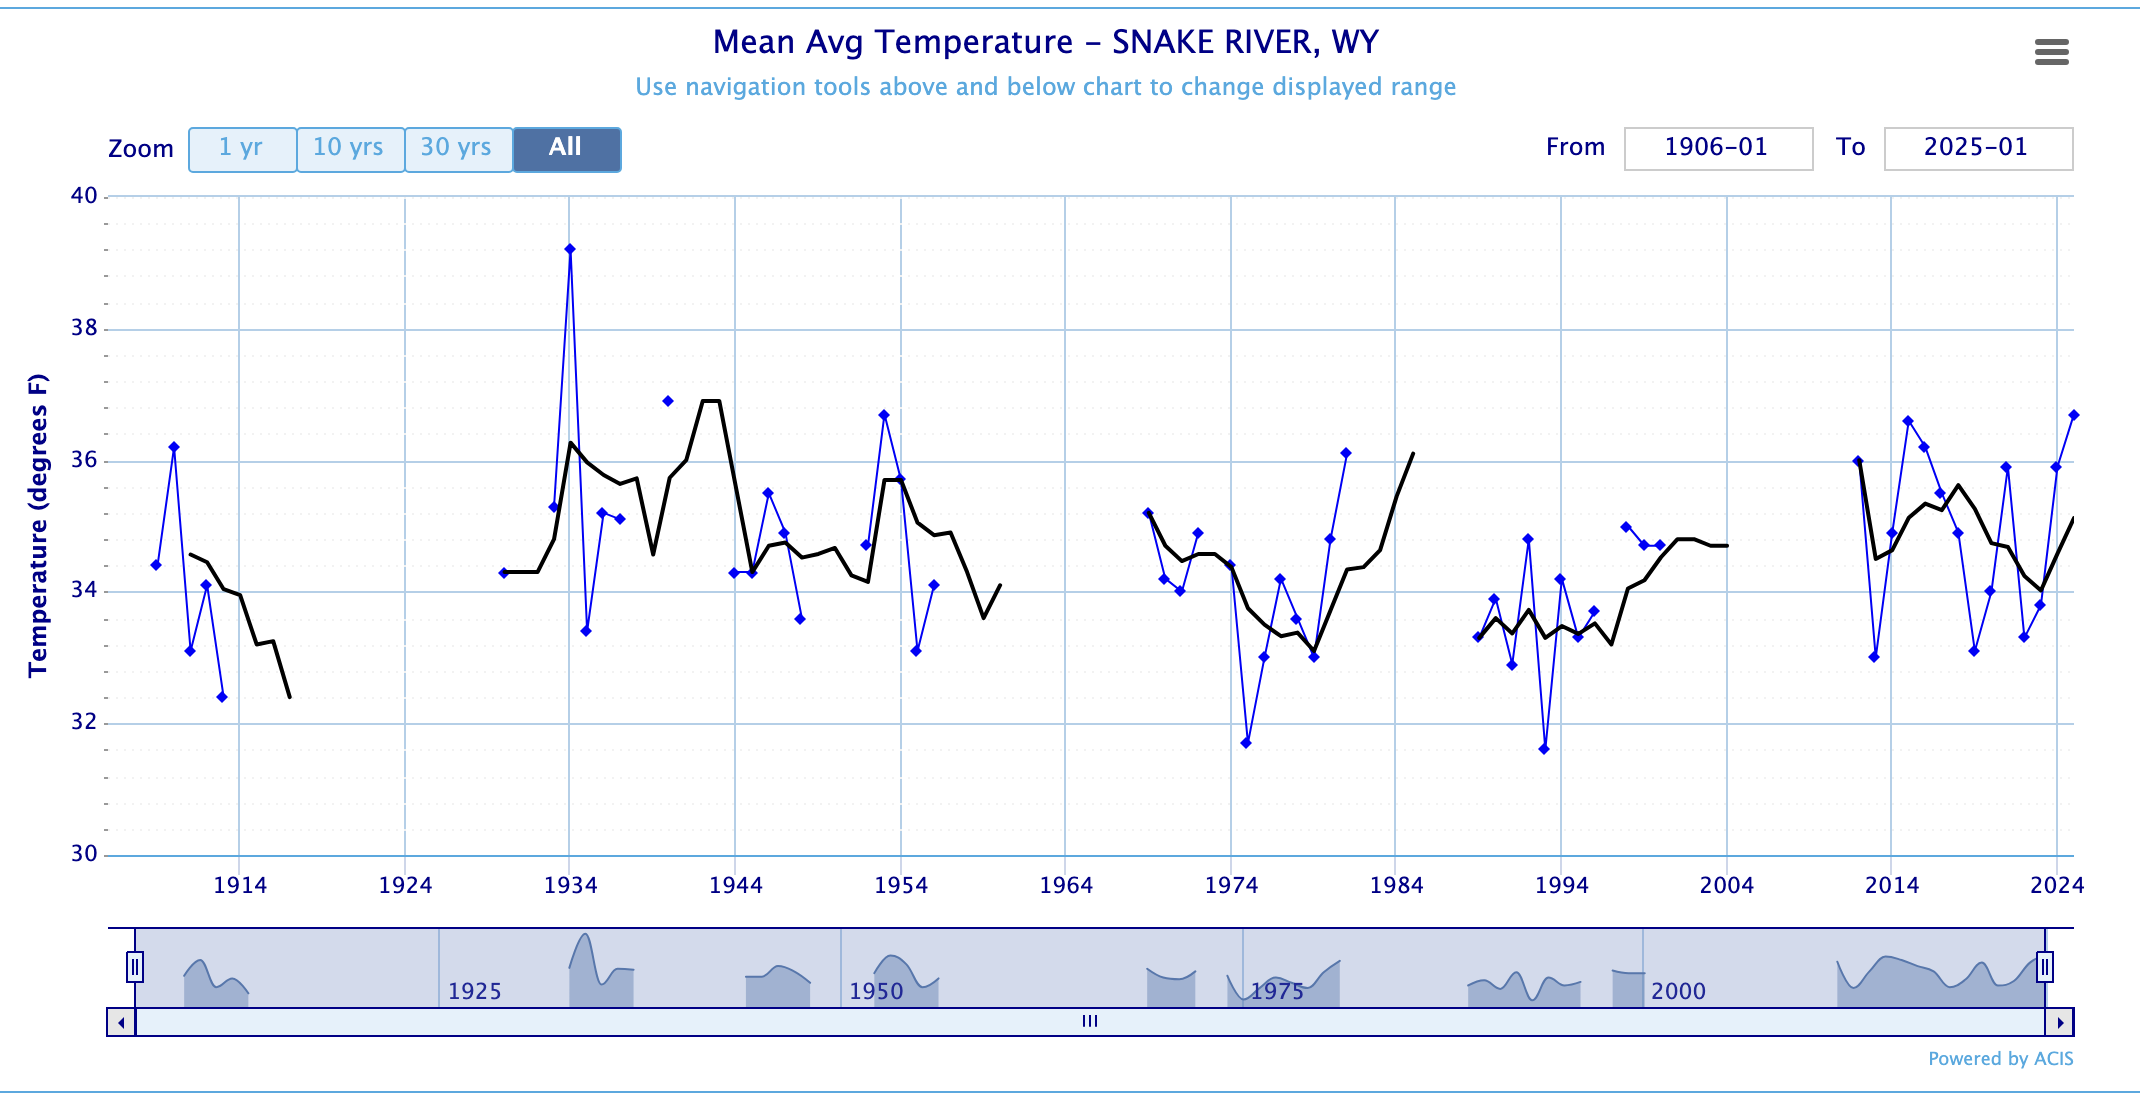
4) Snake River, WY Mean Annual Temperature graph:
The Snake River weather station is located at the South Gate of Yellowstone National Park. It’s earliest observations date back to 1906, but the first complete years of data were 1910 to 1913. Followed by a long stretch of missing years from 1915 to the early 1930’s. Other big chunks of time are missing after that. In September of 1998 it switched to digital (MMTS), and in 2018 switched again to a different type of automated digital thermometer (Nimbus).
Link to PDF of data: SNAKE RIVER
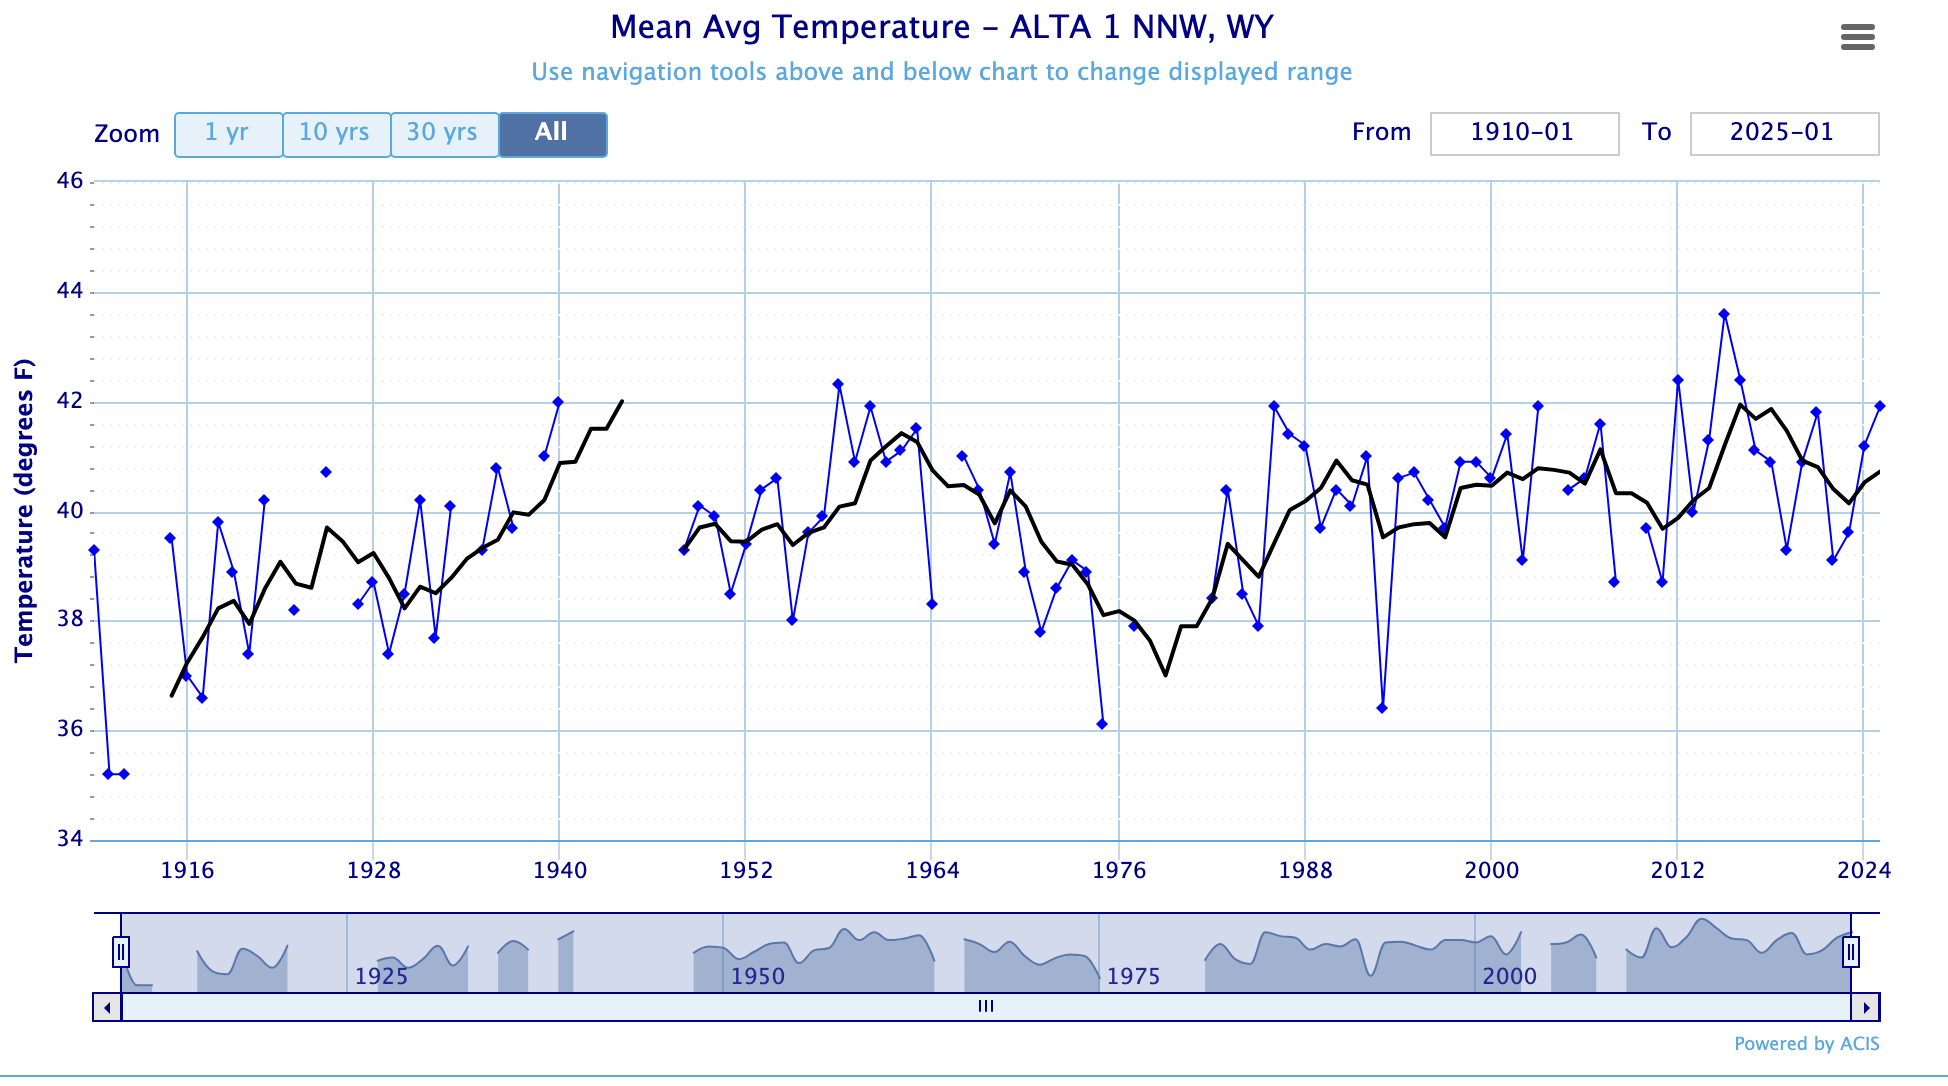
5) Alta, WY Mean Annual Temperature graph:
Located the West side of the Tetons, but still in Teton County, WY, the Alta weather station has it’s earliest readings in 1910, with intermittent observations for several years during the 1920’s, 1940’s, 1970’s, and a few in the early 2000’s. The Alta station switched from LIG to a digital thermometer in September 1986. In April 2017 it switched to a different type of digital thermometer (Nimbus).

Link to PDF of data: ALTA
The Hoc-us-Pocus
So, how does NOAA make their graph look like a continuous record, when we know it is not? They certainly must use all of the real data shown above, but how are they filling in the all the missing years, as well as going back in time to before any official weather observations were taken?
Here is an excerpt from their site explaining their methods:
“Traditionally, climate division values have been computed using the monthly values for all of the Cooperative Observer Network (COOP) stations in each division, which are then averaged to compute divisional monthly temperature and precipitation averages/totals. This is valid for values computed from 1931-2013. For the 1895-1930 period, statewide values were computed directly from stations within each state. Divisional values for this early period were computed using a regression technique against the statewide values (Guttman and Quayle, 1996).”
In other words, they fudged it.
You can get their full explanation of methods here: NCEI Climate Divisions
Follow the Trends
If you scroll back through the graphs of the real data and try to follow the 5-year running means (black lines) across the clustered time periods that have minimal missing data, then you can more clearly visualize that the peaks of the warmest temps are all within one or two degrees Fahrenheit.
JACKSON’S peak in the last 10 years is within a degree of the peaks in the 1950’s.
MOOSE’S latest peak is within 2 degrees of the peaks in the 1970’s. No data prior to 1959 and a major change in location and instrumentation in 2018. Again, you can read my analysis of that station’s data here:Temperatures & Thermometers
MORAN’S most recent peak is actually lower than peaks in the 1980’s & 90’s, and within a degree of peaks in the 1960’s. (As mentioned, prior to the mid-1950s, Moran’s weather station was in a different location).
SNAKE RIVER’S peak from the last 10 years is not significantly different from other peaks in its historical record, considering the scarcity of consistent historical data,
ALTA’S most recent peak is less than 1 degree Fahrenheit higher than the max peak in the 1960’s.
You can call that 1 to 2 degree Fahrenheit change “moderately” warmer instead of “slightly” warmer
One last thing you may not have considered is the change in instrumentation over the last 10 to 20 years or so, from LIG to Digital thermometers. Digital thermometers can register temperature changes more instantaneously than much slower LIG thermometers. For both maximum & minimum temps.
Another look at NOAA’s Data
For comparison, below is a graph of Annual Average (Mean) Temperature for Teton County, WY, which I generated from NOAA’s website: NCEI County Time Series
I also had NOAA’s site generate a mean temperature line for the whole time period, from 1895 -2025, which came out to be 34.6 degrees.

Caveat Emptor!
Bottom-line is, the data NOAA is using here is not a genuine representation of our long-term record of temperature, to the extent it seems they are using data from well outside the Northwest Wyoming region to fill in the blanks. The Question is: from what part of Wyoming?
I perused all of the COOP weather stations in Western Wyoming and found that most had no data prior to 1949, like Big Piney, Bondurant, Pinedale. Afton had no data prior to 1958. There were others with some data earlier than that, extending all the way to Dubois, Cody & Riverton, which all reside east of the Continental Divide in Wyoming, but they also had numerous missing years of data.
As most of us know, weather and the climate varies widely across the state, from the Mountains to the Plains.
The NOAA graphs look very tidy and complete, but when you dig deeper, you realize much of that data is just made up. Especially the data prior to the 1950’s when there was essentially only one station in Teton County with consistent data, Moran, and that was when the thermometers were located at a lower elevation near the river, giving it a cold bias. (Again, here is what I wrote about the Moran weather station’s history: Teton Park nights are warmer…).
Factoring in changes in some station locations over the years, along with instrument changes in more recent years, it really makes analyzing the long-term record even more challenging. As a meteorologist, I am not one for accepting what is presented (especially from computer models) without further investigation and confirmation.
If I was not so intimately familiar with our local weather stations and climate records, I would never have suspected the NOAA graphs were as contrived as they are. Close maybe, but no cigar.
I am not disputing that temperatures now are slightly warmer or moderately warmer than in the late 1800’s to early 1900’s, following the Little Ice Age — with the exception of the 1930’s, which throughout most of the western U.S. were decidedly warmer than recent years.
Given what we know from actual historical weather observations, versus what is displayed on NOAA’s graphs, one must question the validity of the data they used, considering the scarcity of data available from the early 1900’s for Teton County.
As Robert Mallet said in the Manual of Scientific Inquiry, back in 1859:
“Nature, rightly questioned, never lies.”
Post by meteorologist Jim Woodmencey.
Jim is the chef meteorologist at MountainWeather.com and has forecast and written about Jackson’s weather for nearly 35 years, and has lived in Teton County, WY since 1982.