Mountain
Weather
™
Jackson Hole
Jackson Hole Forecast
Current Conditions
Local Reports & Info
Local Climate
Yellowstone Park
Mountain States
Alaska
South-Central Alaska
Southeast Alaska
Alaska Models
California
Colorado
Idaho
Montana
Oregon
Utah
Washington
Wyoming
New England
Weather Maps
Satellite & Radar
Surface Maps
Upper Air Maps
USA Forecast Maps
NWS Forecast Info
Computer Models
Long Range Outlooks
More Weather Pages
MountainWeather Lite
Snow Reports
Mountain Weather Blog
Info & Services
About Us
Weather Courses
Forecast Services
Advertising
Contact Us
Your Source for Weather in the Mountains
Skip to content
Jackson Hole
Jackson Hole Forecast
Current Conditions
Local Reports & Info
Local Climate
Yellowstone Park
Mountain States
Alaska
South-Central Alaska
Southeast Alaska
Alaska Models
California
Colorado
Idaho
Montana
Oregon
Utah
Washington
Wyoming
New England
Weather Maps
Satellite & Radar
Surface Maps
Upper Air Maps
USA Forecast Maps
NWS Forecast Info
Computer Models
Long Range Outlooks
More Weather Pages
MountainWeather Lite
Snow Reports
Mountain Weather Blog
Info & Services
About Us
Weather Courses
Forecast Services
Advertising
Contact Us
All posts by
Jim Woodmencey
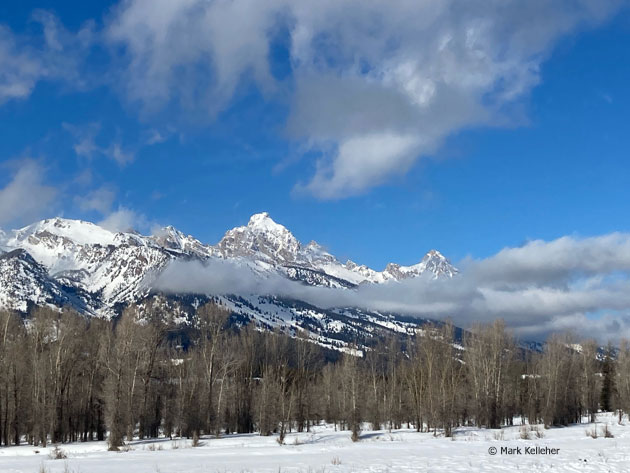
Clouds Linger Tetons
January 19, 2021
Photo of the Week
Jim Woodmencey
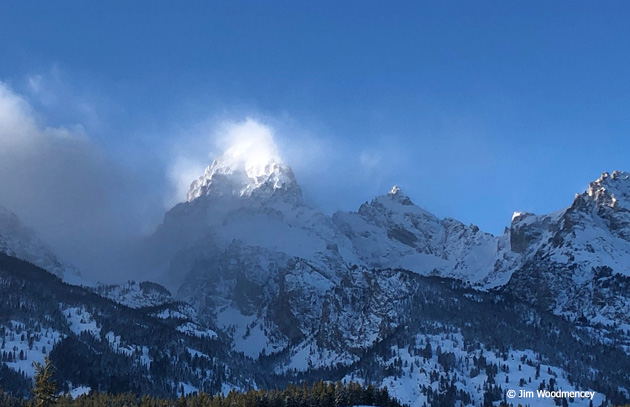
Grand Light
January 8, 2021
Photo of the Week
Jim Woodmencey
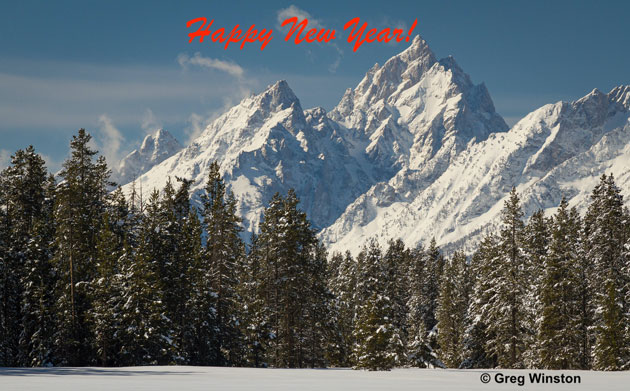
Happy New Year 2021
December 22, 2020
Photo of the Week
Jim Woodmencey
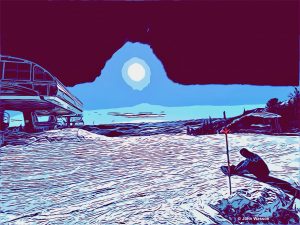
Inversion
December 19, 2020
Photo of the Week
Jim Woodmencey
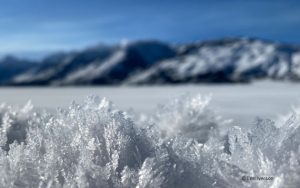
Hoar Frost
December 10, 2020
Photo of the Week
Jim Woodmencey
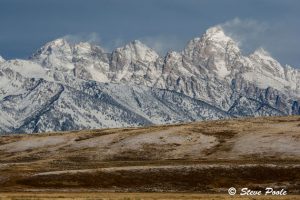
Windy Tetons
November 17, 2020
Photo of the Week
Jim Woodmencey
Thank You Vets
November 11, 2020
Photo of the Week
Jim Woodmencey
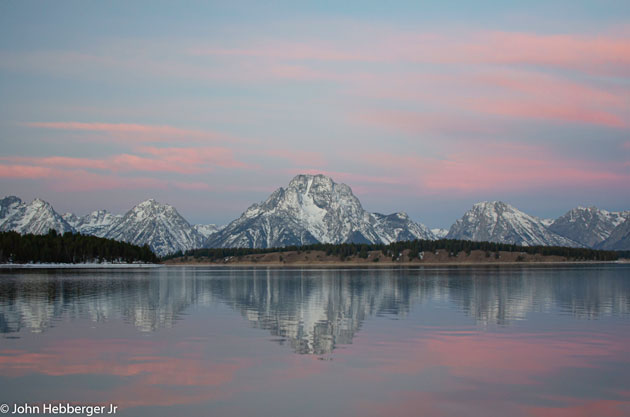
Jackson Lake Sunrise
November 7, 2020
Photo of the Week
Jim Woodmencey
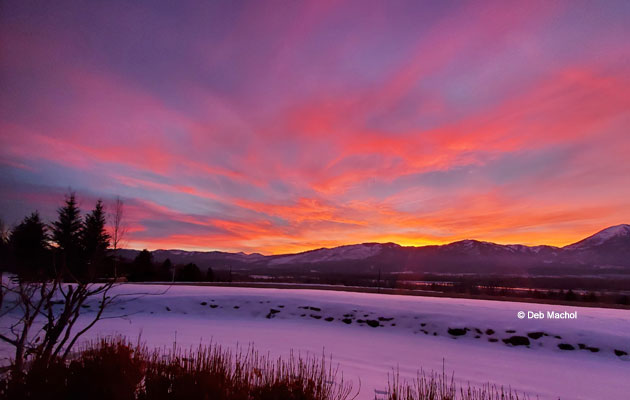
October Sky
October 31, 2020
Photo of the Week
Jim Woodmencey
Mt. Glory Sunset
October 19, 2020
Photo of the Week
Jim Woodmencey
Posts navigation
←
Older posts
Newer posts
→