All posts by Jim Woodmencey
Neowise over the Tetons
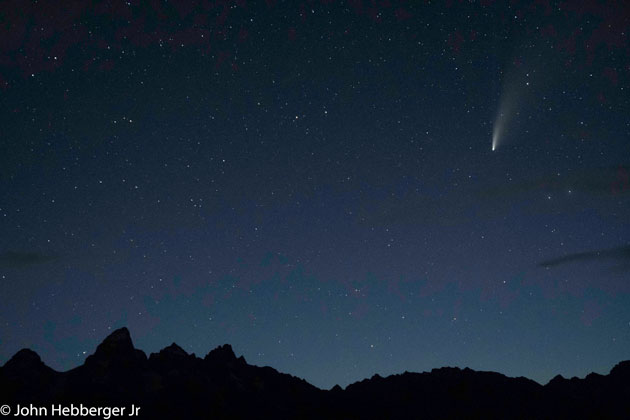
Comet Neowise

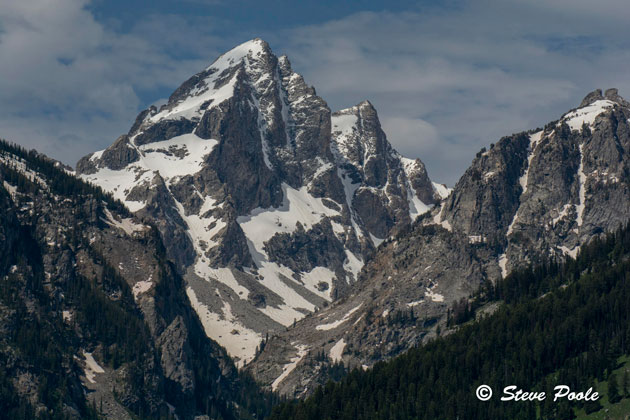
Buck Mountain
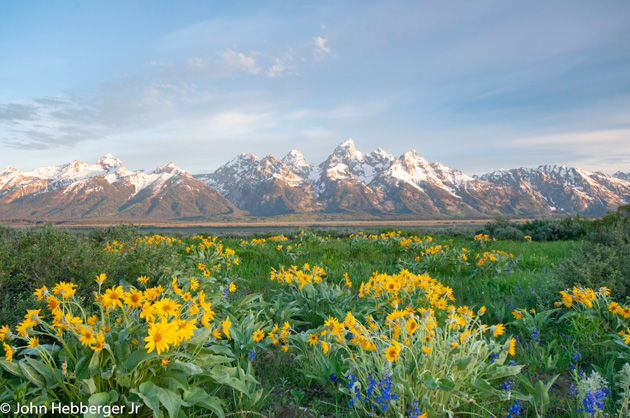
Happy 4th of July

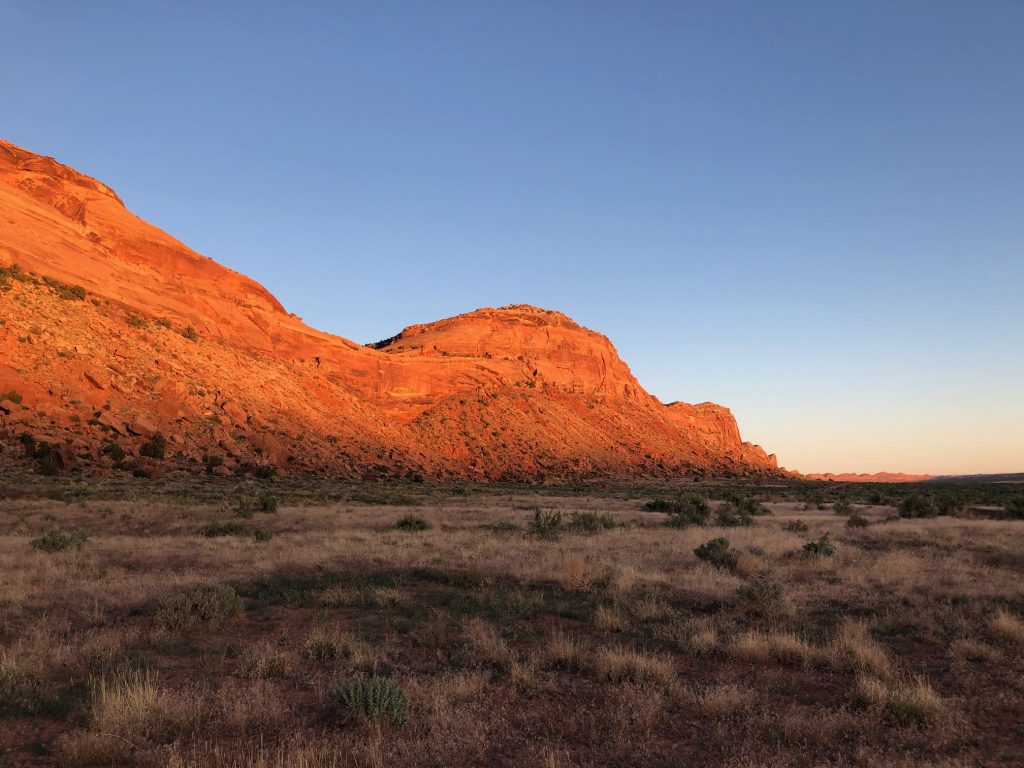
Spring Flowers at Sunrise
Defining the Wind
One of my all-time favorite weather books is Defining the Wind, by Scott Huler. It is the story of Sir Francis Beaufort (1774-1857), an admiral in the British Navy, former head of the British Hydrographic Office and the first person to quantify the wind.
Beaufort had great observational weather skills. After years of sailing the world’s oceans, Sir Francis put together a scale by which one could communicate how strong the wind was blowing, based on the condition of the sea. The Beaufort Scale was first introduced in 1805, with a 13-point scale to denote the strength of the wind, ranging from calm to hurricane force.
The scale was originally used to let sailing ships know how much sail to carry. As sails switched to steam, the scale was modified. Today’s more modern version also includes visual clues for land-lubbers and assigns the relative wind speeds associated with those visual observations.
My Observations
I recently spent a week in the desert of Southern Utah, watching the wind blow the tumbleweeds around. With no computer, no cell or Internet service, totally off-the-grid, I had to simply observe the weather and gauge the wind, without any access to weather information or instruments. I thought of Beaufort.
Out there in the middle of the desert, I could observe the scarce trees sway, the sand getting transported, and of course, dodge those annoying tumbleweeds. I could translate my observations to a specific wind speed, without a fancy anemometer, thanks to Beaufort’s work from a couple hundred years ago.
I still refer to the Beaufort Scale from time to time when I am out in the backcountry or observing winds around the valley, with a pdf copy of the scale on my iPhone as a reference.
Beaufort’s Scale
Beaufort, along with every other sailor, used knots (nautical miles per hour) as their measure of speed. Although wind speeds were added to the scale after Beaufort’s death, I thought it would make a good history lesson to understand how speed was calculated back then and where the unit of knots came from.
Measuring the speed at which a ship was moving involved a length of rope with knots tied at uniform intervals, 47 feet 3 inches apart, to be exact. The rope was tossed over the back of the ship, with a piece of wood tied to the end of it. The rope was allowed to feed out through a sailors hands, measured with an hourglass or sand timer for 30-seconds.The number of knots that fed out in that time were counted to determine the ship’s speed.
Beaufort’s original scale related the observed conditions of the sea to an approximate strength of the wind, from zero being calm to 12 being a Category-1 hurricane. In 1946 the International Meteorological Committee extended the scale to 17 points, to cover winds speeds up to Category-5 force, of 157 mph or higher.
Click for a printable copy of the Beaufort Scale >> 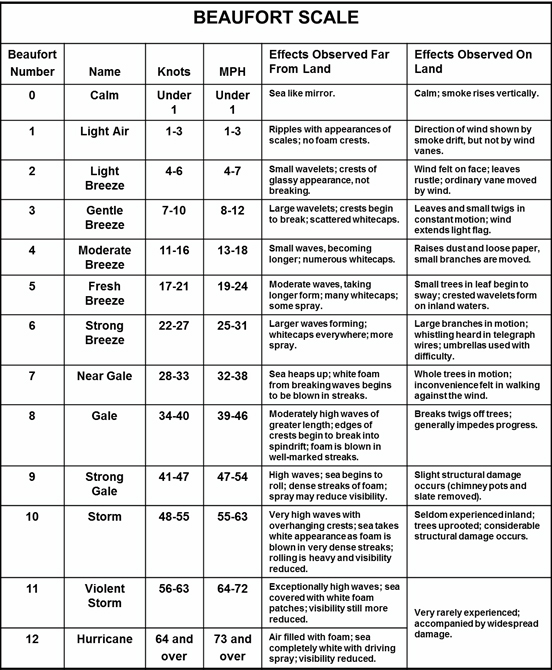
Speed versus Force
Compare a rating of 5 on the Beaufort Scale, a “Fresh Breeze”, which forms moderate waves with many whitecaps, in the ocean. On inland lakes, crested wavelets form and small trees begin to sway. That relates to a speed of 17 to 21 knots or 19 to 24 mph.
If you double that speed, make it 34 to 40 knots (39 to 46 mph), you would have what is described as a “Gale”, an 8 on Beaufort’s scale. Moderately high waves on the ocean, twigs breaking off trees on land. Walking into that wind would become difficult.
As wind speed increases, the strength does also, and it does it exponentially. Effectively, if you double the wind speed, you quadruple the force of the wind. Newton’s Second Law of Motion explains why:
Force is equal to mass times acceleration (F = ma). Acceleration is velocity squared. Velocity is speed. Thus, a doubling of the wind speed results in an exponential increase in the force of the wind.
To keep the physics simple, a 40 mph wind is not twice as strong as a 20 mph wind, it is actually four times stronger.
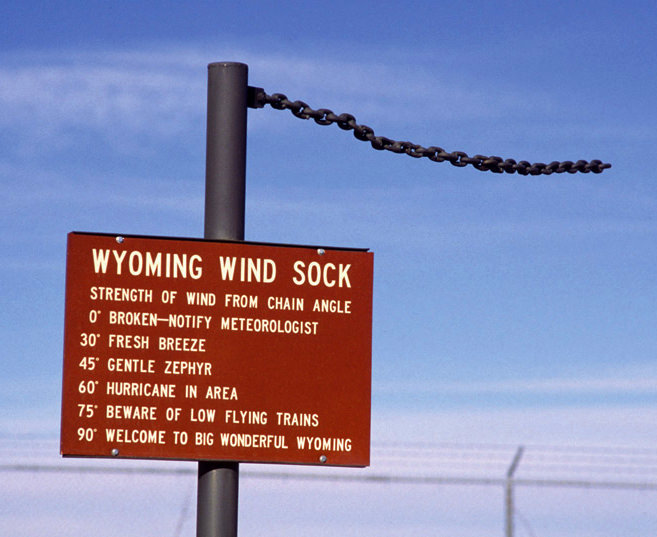
The Wyoming Wind Sock is how we gauge the wind out here!
Feel the Force
We can sense that force every time we experience strong winds on the lake, up in the mountains, or out in the desert. The beauty is, with Beaufort’s scale we can assign a speed to what we observe, on water or on land.
Try using Beaufort’s Scale to estimate the wind speed when you are out and about this summer. As the author of Defining the Wind put it, “The human body is the greatest perceptive instrument ever designed.”
My time in the desert with the tumbleweeds allowed me to reflect on the wind in its most basic form. It’s kind of refreshing to exercise your observational skills and not always rely on technology to tell us everything.
(Note: This post originally appeared in the Jackson Hole News & Guide, June 3rd, 2020 issue, but unfortunately without the Beaufort Scale or other photos.
Post by meteorologist Jim Woodmencey
Going from Hot to Cold
This past week has been warmer than normal over much of the Western United States, warm at least for late May and early June. In Jackson Hole we just had a string of days topping 80 degrees, 82-degrees for a high temp in town on May 29, 30 & 3, 2020. Looks like we’ll be back to around that same temp at the end of this week. Then, it gets abnormally cold for early June.
None of that was record high territory, but it sure feels warm for this time of year. Back in 2003 Jackson had a high of 90-degrees on May 29th and in 1988 there was a a couple of days in the first week of June that tagged 89-degrees.
This weekend and into early next week is looking much cooler and also it looks like we’ll get some precipitation this weekend, something that was lacking most of May.
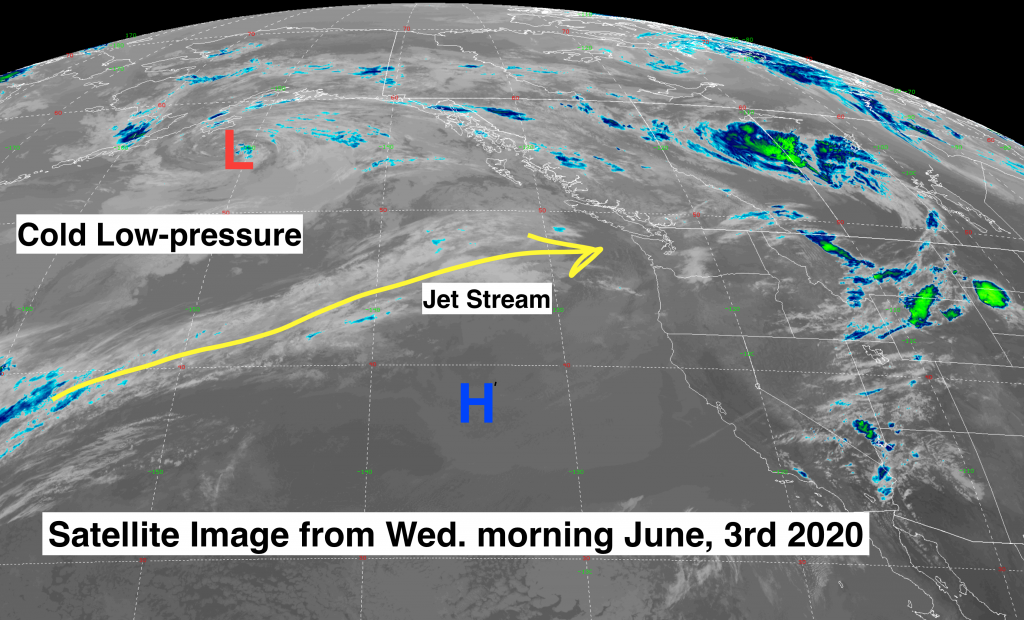
Cold Low-Pressure Coming
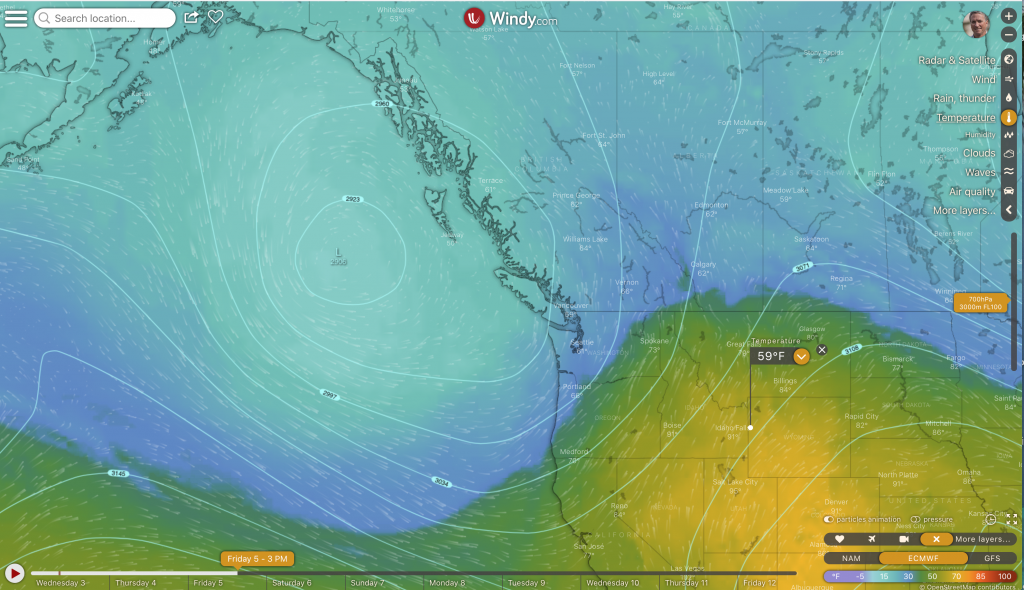
A very cold Low-pressure system that is sitting in the Gulf of Alaska is going to slow-roll its way across the Pacific Northwest at the end of this week. A stronger southerly flow aloft ahead of that Low will bring the warm temps up from the Desert Southwest on Friday. Then the cooling begins Saturday through Monday.
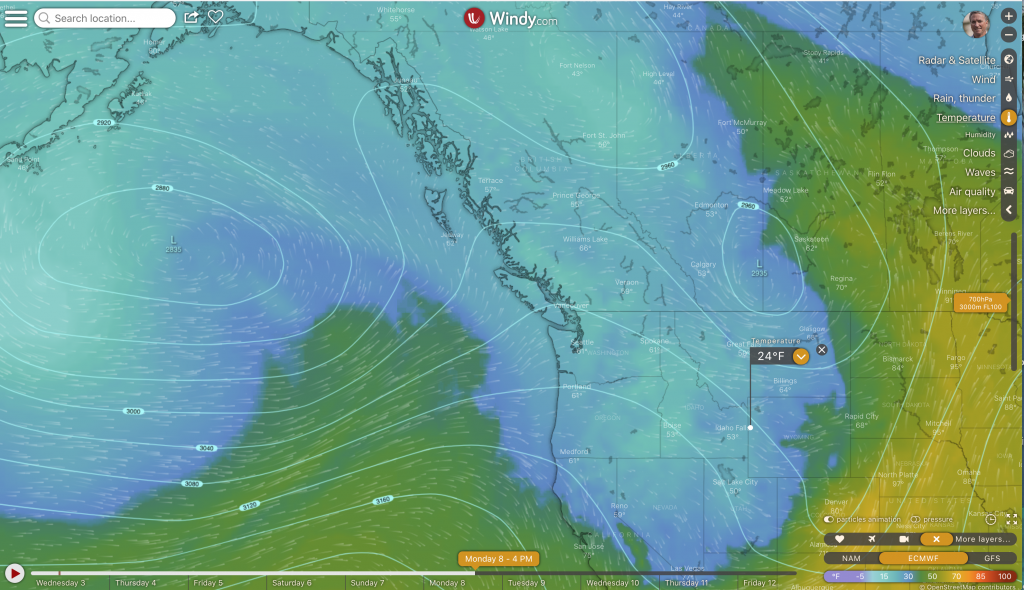
We could see a drop in temperatures of almost 40-degrees, based on daytime highs. That means by Monday, June 8th, the high temps in Jackson might not get out of the 40’s! The number to beat on that date is a high of only 43-degrees, which occurred here in 1950, for a record cold maximum temp.
Mountains also go Warm to Cold
Mountain temperatures have been very warm this past week, as well. Highs at the top of the Tram at Jackson Hole Mountain Resort were tagging 60-degrees this past weekend, with overnight lows temps in the 40’s up there. The freezing level during the day were was above the summit of the Grand Teton (14,000-ft. +).
CLICK image below to play video of computer model forecast.
This has led to a pretty good melt-down of the snowpack and subsequent run-off into the creeks and rivers. That will all screech to a halt after this weekend. Looks like by Monday the temperatures will not get above freezing at 10,000-ft.
Hope you didn’t get too used to the warm, because it is about the swing in the other direction.
Keep up with the latest forecast info for Jackson Hole and the Teton Mountains as the weather this weekend goes through these changes: Click for JH Forecast
Post by meteorologist Jim Woodmencey
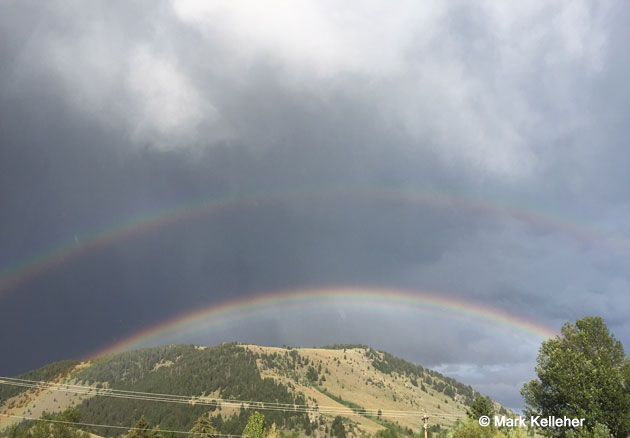
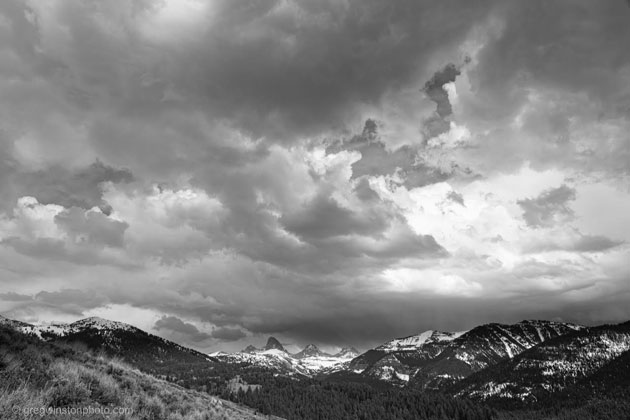
Spring Storm Clouds
Solar Halo