As I have done for many years now in my column for the Jackson Hole News & Guide, I’ll review the winter season’s snowfall and see how it compared to past years.
In case you missed it, this February had record-breaking snowfall, both in the valley and the mountains. That month alone is what truly made this winter extraordinary.
As you can decipher from the tables below, each winter’s snowfall distribution is a little different. What stands out is, that two out of the last three winters were exceptionally powder-ful, with well above average snowfall in both the mountains and the valley.
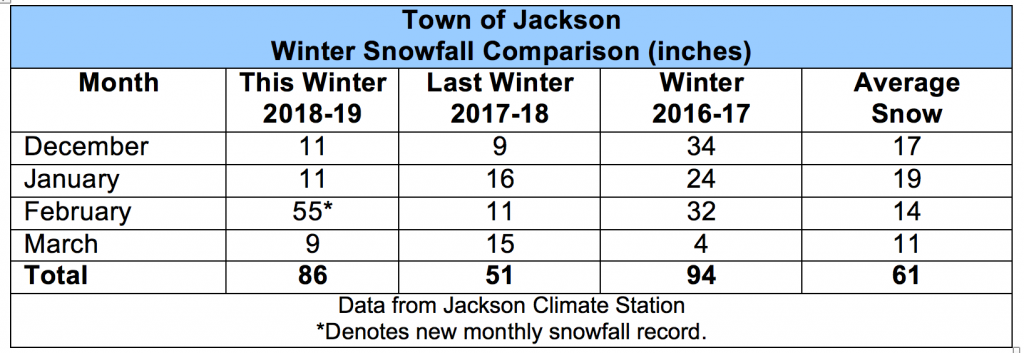
Town of Jackson Snowfall Stats
Snow measured at the Jackson Climate Station totaled 86 inches between December 1st, 2018 and April 1st, 2019.
That is the official count, however, there were roughly three weeks, from January 9th to 29th, 2019, when snowfall measurements were not taken, due to the government shutdown. Therefore, the actual four-month snowfall total for town was probably between 90 and 100 inches.
The long-term historic average snowfall for Jackson, from December through March, is 61 inches. Which means that this winter’s snowfall was at least 40-percent more than the average.

Note that more than half of this winter’s snowfall came in the month of February. The 55 inches we received during February 2019 established a new record for February snowfall. It also placed February 2019 as the second snowiest month ever, in Jackson’s recorded weather history.
Two winters ago, in 2016-17, Jackson also had big snowfall. Town received 94 inches of snow in the December through March time-frame. But, that winter was much warmer. This winter was much, much colder.
It Was a COLD Winter Too
This winter we experienced average high temperatures that were significantly colder than the long-term historic average, for every single month, from December through March.
What really blew me away was that average low temperatures were also well below normal, every single month. That usually only happens during dry winter months.
The biggest departure in temperature happened in March, with an average high temperature of 33-degrees for March 2019. That is 7 degrees colder than the long-term average high temperature in March, of 40-degrees.
The average low temperature this March was 5.6-degrees, which is nearly 10 degrees colder than the long-term average low temperature for March in Jackson, of 15 degrees. That is a significant cool down.
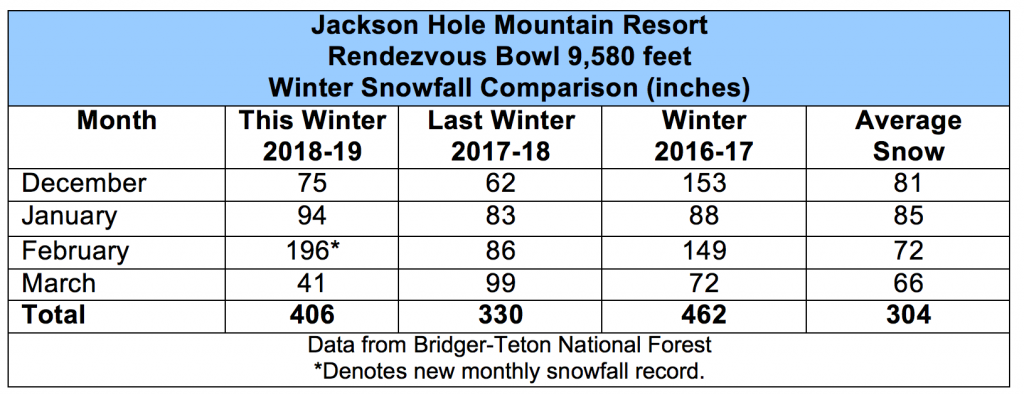
February’s Record Mountain Snowfall
Analyzing the data from the Rendezvous Bowl weather station at the 9,580-ft. elevation of the Jackson Hole Mountain Resort, I found the total snowfall from December 1st, 2018 to April 1st, 2019 was 406 inches.
Almost half of that total amount fell in February this year, establishing a new February snowfall record on the mountain with 196 inches.

The average total snowfall at Rendezvous Bowl, for December through March, is 304 inches. That additional 100 inches puts this winter’s “ski season” snow total at 133-percent of average.
For the same time period during the big winter we had two years ago, in 2016-17, 462 inches of snowfall was recorded at Rendezvous Bowl. February 2017 accounted for 149 of those inches, which is now the old February snowfall record, after this February blew that one away.
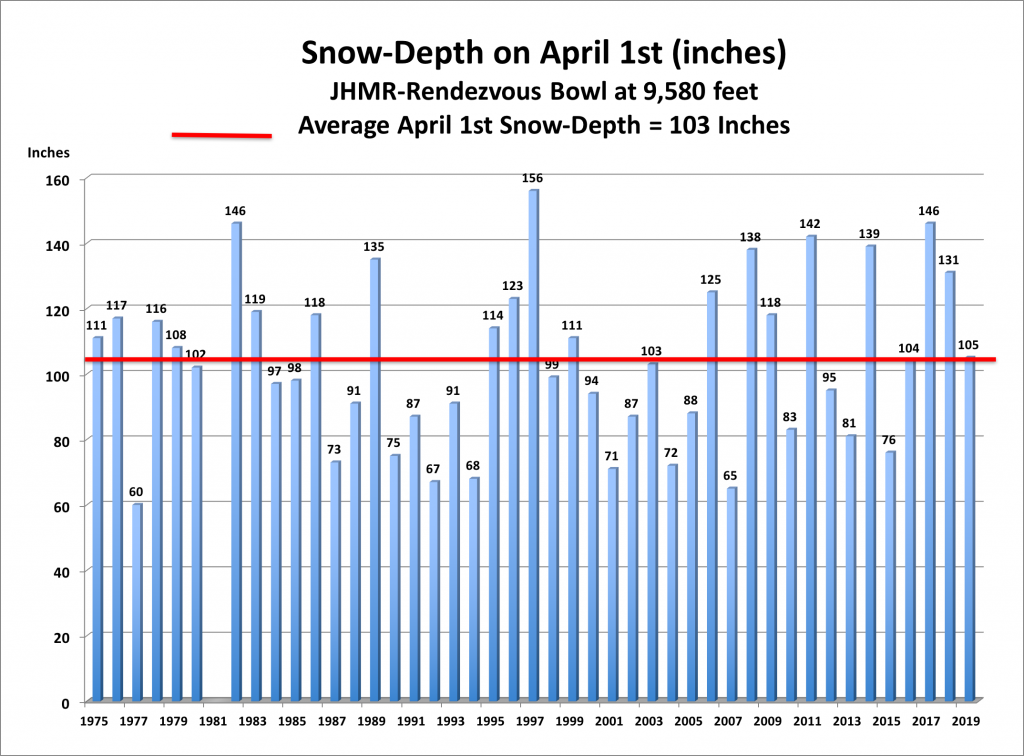
End of Season Snow-depth
Another way to gauge the winter season is by looking at the settled snow-depth in the mountains on April 1st.
At the Rendezvous Bowl site, the settled snow-depth was 105 inches on April 1st, 2019. The long-term historic average snow-depth on April 1st is 103 inches. Which means snow-depths at the end of winter, at that elevation, were very close to normal.

In comparison, and this might surprise you, last year on April 1st the snow depth at Rendezvous Bowl was 131 inches, assisted by the 99 inches of snow that fell in March 2018. Two seasons ago, on April 1, 2017, the snow depth stood at 146 inches.
While snow-depths and snowfall in the valley were reaching record levels this winter, snow pack in the mountains ended up much closer to normal than you would think.
Posted by meteorologist Jim Woodmencey