All posts by Jim Woodmencey
The Solstice, Santa & Snow
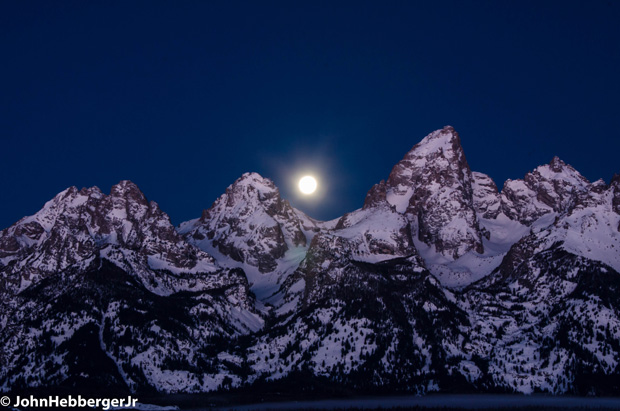
Welcome to Winter! The Solstice was December 21st, 2018, at 3:23 pm MST. One cool feature of this year’s Solstice is a full moon, or almost full. The peak of that full moon is on Saturday, Dec. 22nd.
Scroll down to see updated snow accumulation forecasts for Christmas.
Snow on Ground
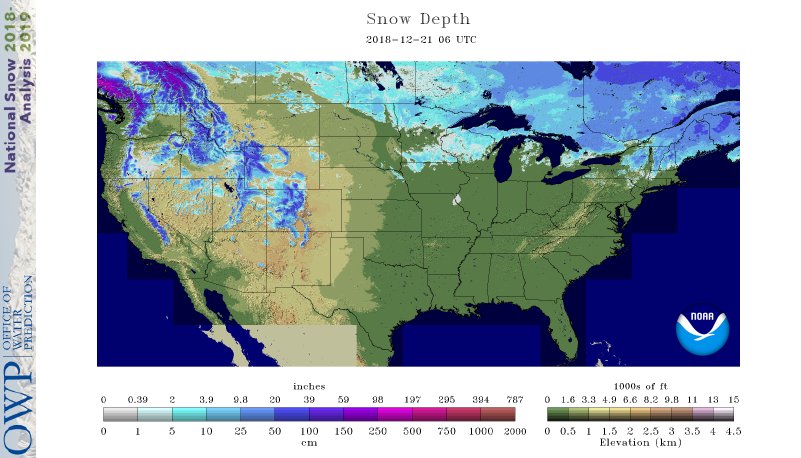
This year on the Winter Solstice there is pretty good snow-cover across the Norther tier of the United States, especially in the northern & central Rockies, the Cascades of Washington and in British Columbia’s mountains.
Snow depths December 21st, 2018 below
Compare that to last year on the same day….
Snow depths December 21st, 2017 below
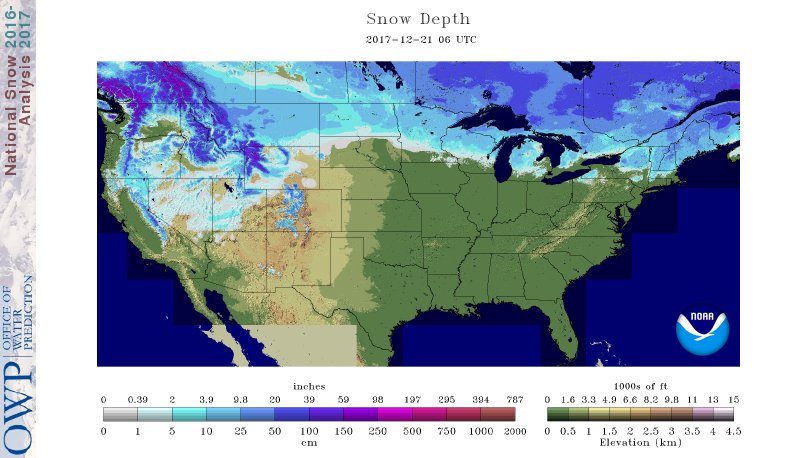
Last year on the Solstice there was more snow at lower elevations across the northern tier of the U.S. But similar depths in the mountains.
New Snow for Santa
Below are a couple of different computer model forecasts of total new snow accumulation expected between Saturday and Christmas Day, December 22nd through December 25th.
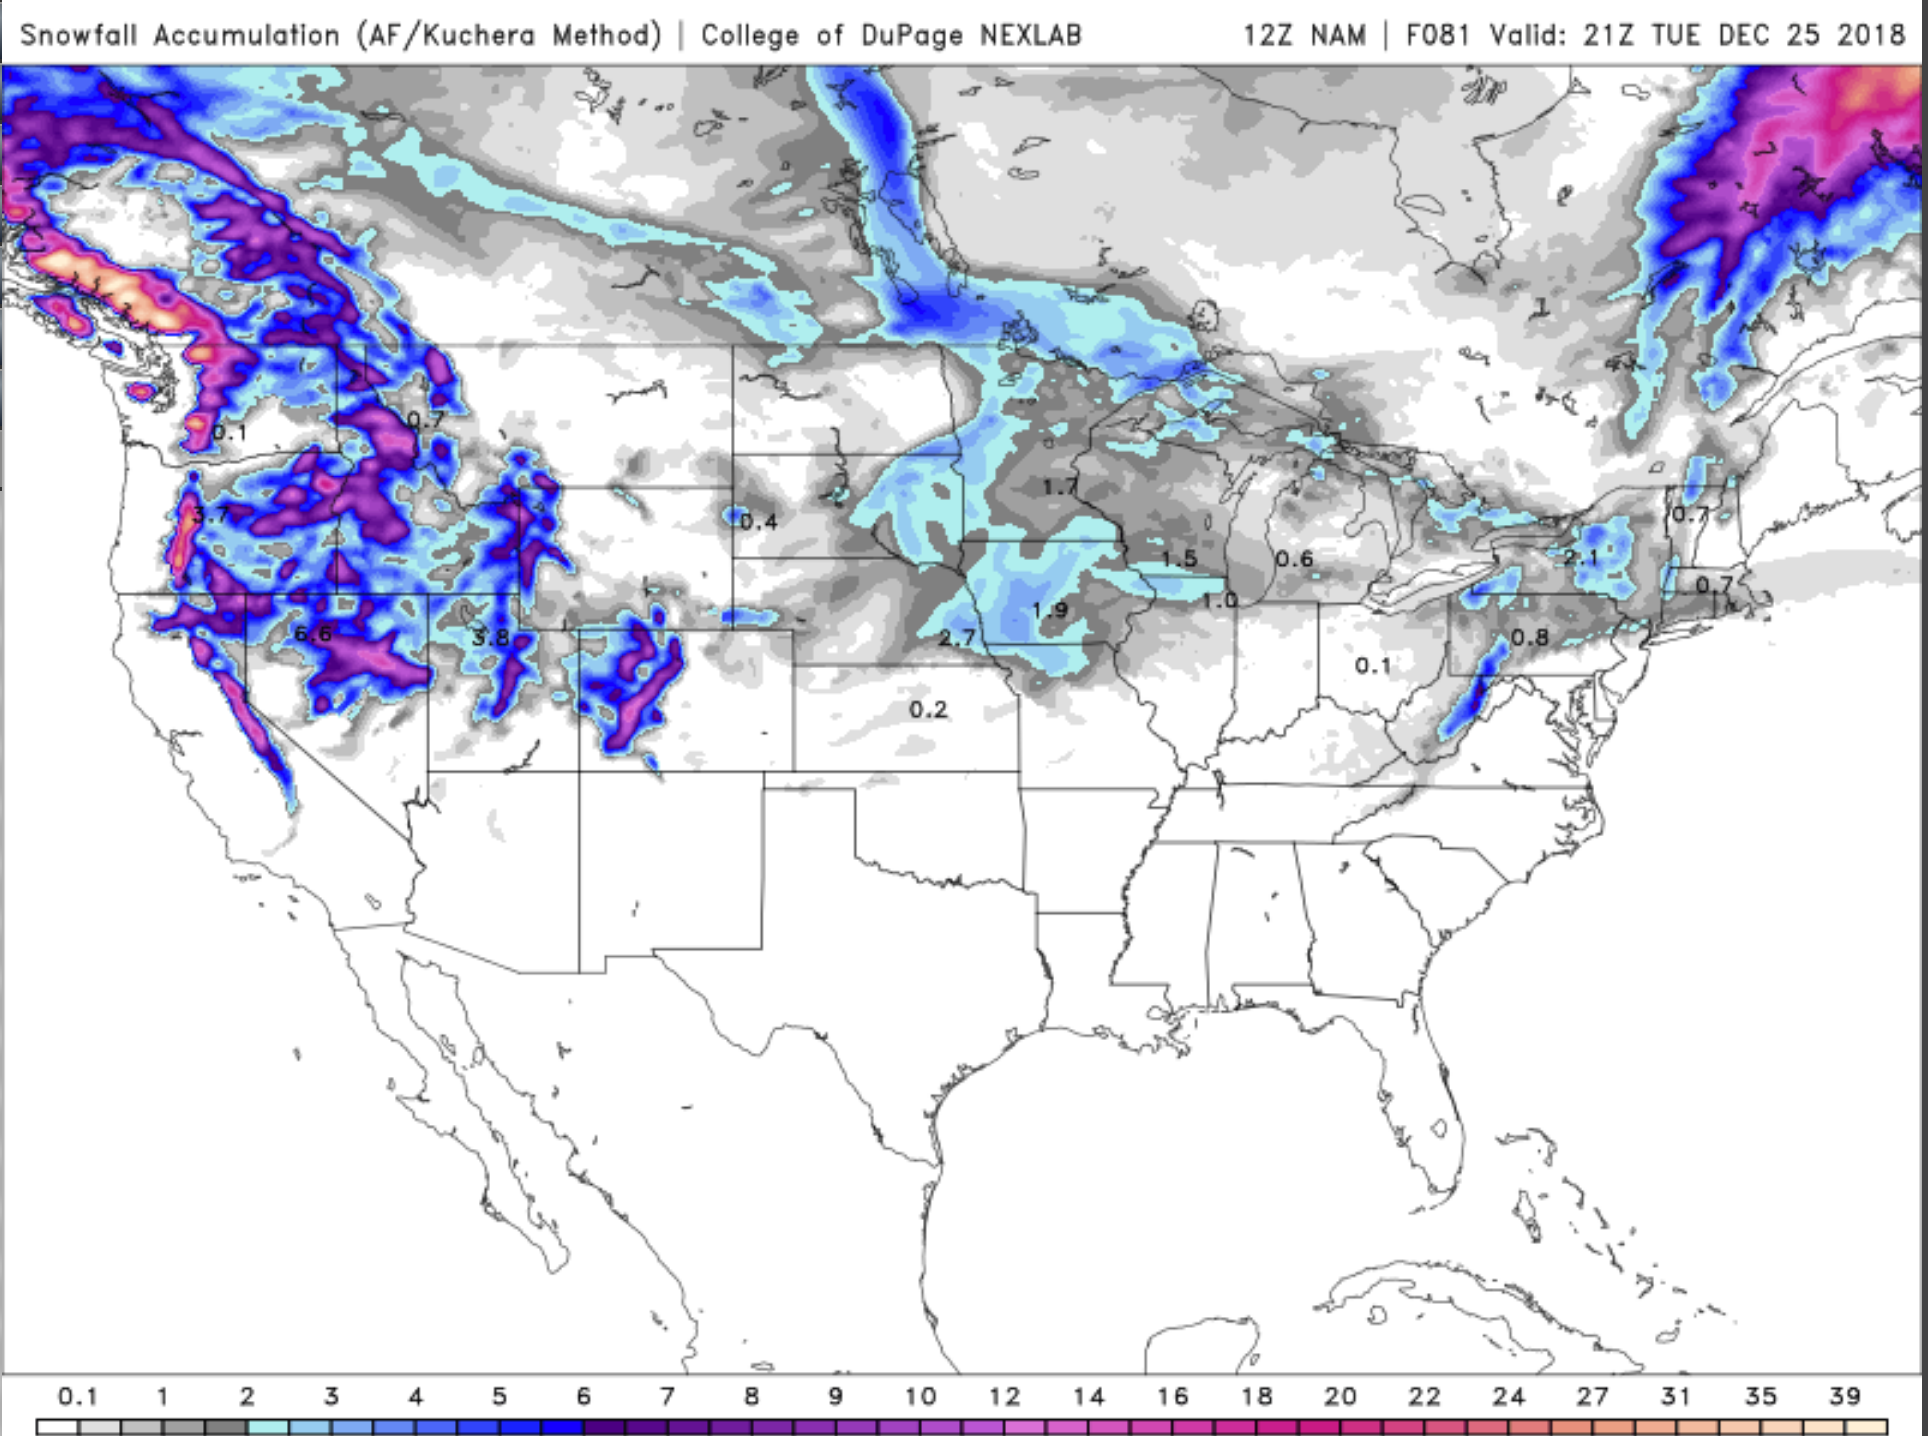
Looks like coastal British Columbia’s mountains & parts of the higher Cascades could get up to two feet of new snow through Christmas Day.
Northern Idaho, western Wyoming, northern Utah and parts of Colorado’s Rockies should get at least 6 inches and some locations will see a foot or so of fresh snow. Most of which arrives Sunday & Monday.
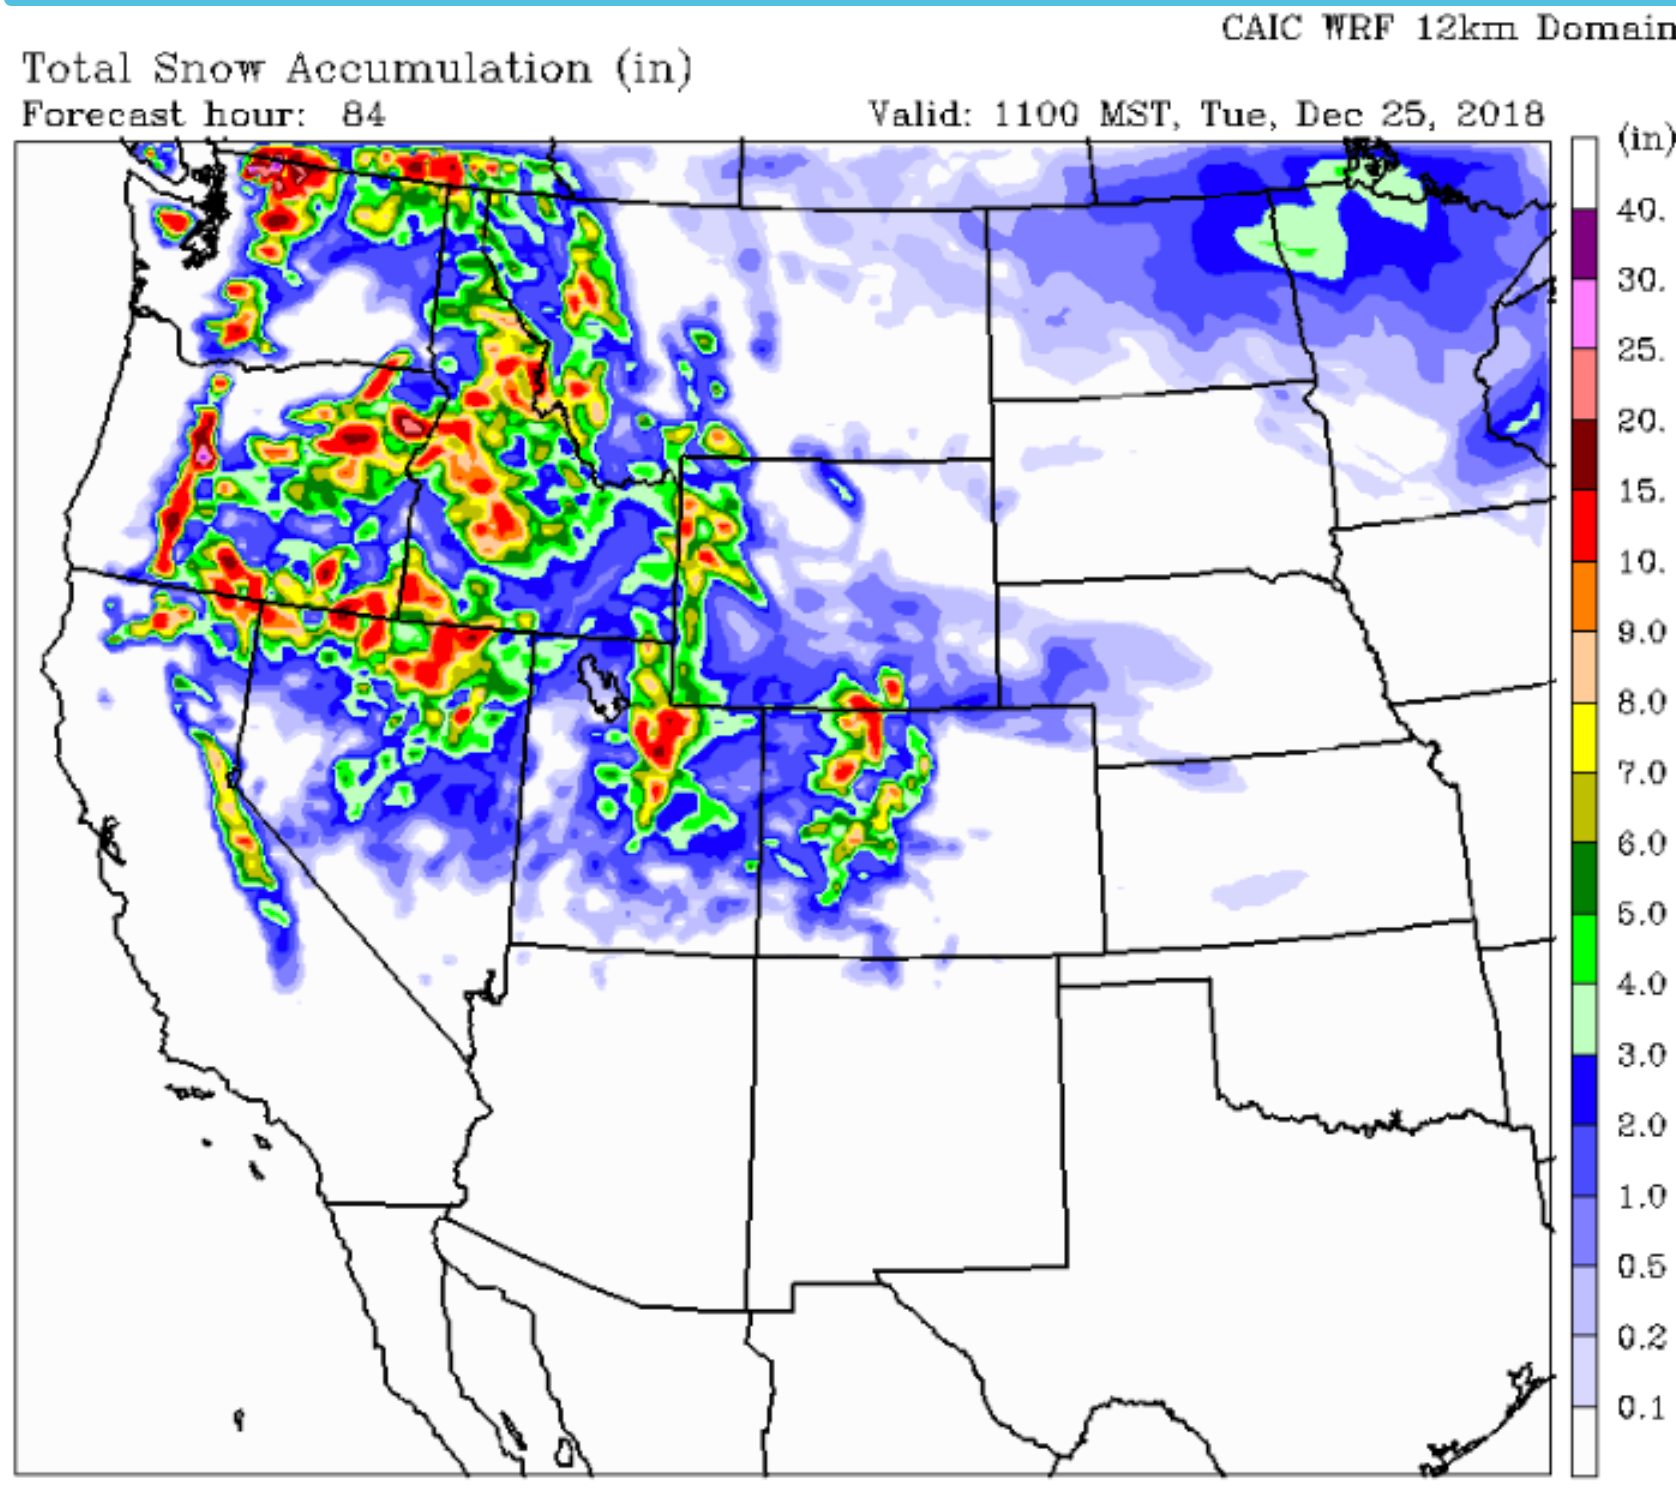
This new snow is brought to us by a relatively strong Westerly flow that will be streaming across the northern tier of the United States this weekend.
Low pressure systems embedded in that flow, along with cold air pushing southward over the northern half of the U.S. will help assure a little more white stuff on the ground in the above mentioned areas, for Christmas Day.
Merry Christmas Everyone!
Post by meteorologist Jim Woodmencey
Updated Winter Outlook
The Climate Prediction Center, CPC for short, since late this past summer has maintained a pattern of keeping the Pacific Northwest and northern Rockies under the category of “Equal Chances”, for having above normal or below normal precipitation during the winter months os 2018-19.
That covers the three-month period, December through February. This same trend of non-committal, 50/50 forecasts of precipitation probability, continues right through April of 2019. Precip map below….
Temperatures from December through the end of winter and into the spring season are forecast to be above normal, across the entire western United States. Temp map below…
From all of that, I guess we should expect temperatures to be milder this winter. Whether we will see more or less snow than average, however, is still a coin-flip.
El Nino Update
The latest update from the CPC done on December 10th, 2018 about the status of the predicted coming of an El Nino for this winter shows that they are still 80-percent confident that an El Nino will form and will continue through the Northern Hemisphere winter 2018-19.
The Equatorial Pacific Ocean has most recently been stuck in Neutral, or “No-Nino” conditions, since this past February.
Review: El Nino is one phase of ENSO, the El Nino Southern Oscillation. This oscillation reflects the changes in sea-surface temperatures in the Equatorial Pacific. During an El Nino phase, ocean temperatures are warmer than normal. During a La Nina phase, ocean temperatures are cooler than normal.
When temperatures are normal, it is called, “Neutral”, or No Nino.
Typically, an El Nino brings warm and dry conditions across the Pacific Northwest and Northern Rockies. At the same time, it brings wetter and cooler winters to California and the southwestern United States.
La Nina winters are usually more favorable for bringing bigger snow winters to the Pacific Northwest and northern Rockies, including the Teton Mountains.
Read more about the current state of ENSO here: NWS ENSO page
El-La-No for Jackson Hole
I did an analysis of winter season snowfall versus the state of the ENSO each season and found a few interesting facts from the last 40+ years. I used the Rendezvous Bowl data on the upper mountain at the Jackson Hole Mountain Resort, from the winter of 1974-75 through last winter 2017-18.
Graph of data below:
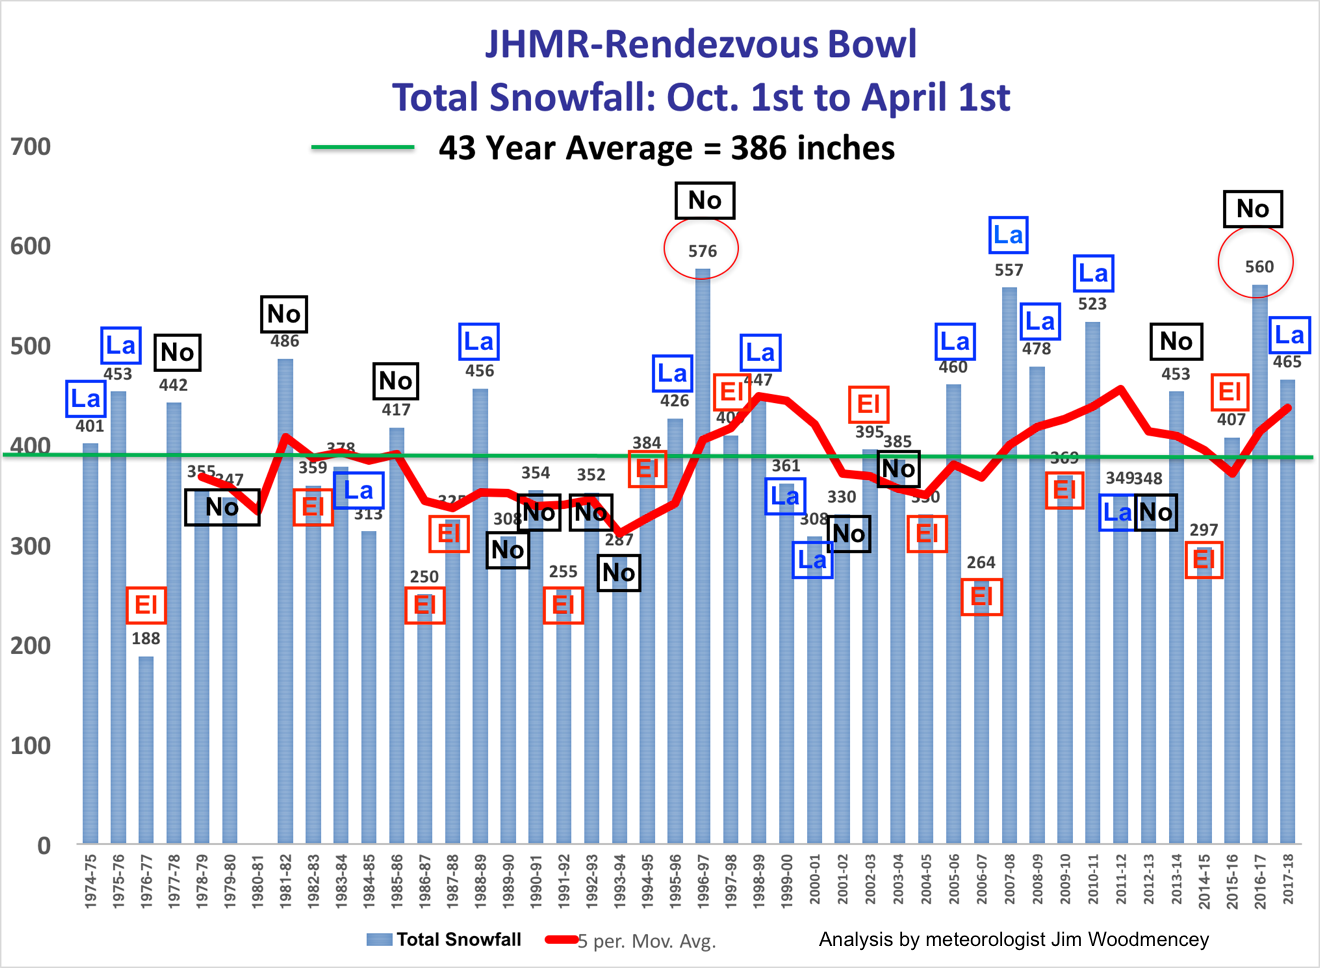
Summary of JHMR Data:
1) There were 15 La Nina winters, 10 of those had above average snowfall.
2) There were 14 No Nino winters, 6 of those had above average snowfall. Including the two biggest winters ever, 1996-97 & 2016-17).
3) There were 13 El Nino winters, only 3 of those had above average snowfall.
Could this El Nino that is developing be number four? We can only hope.
Farmer’s Predictions Look Better
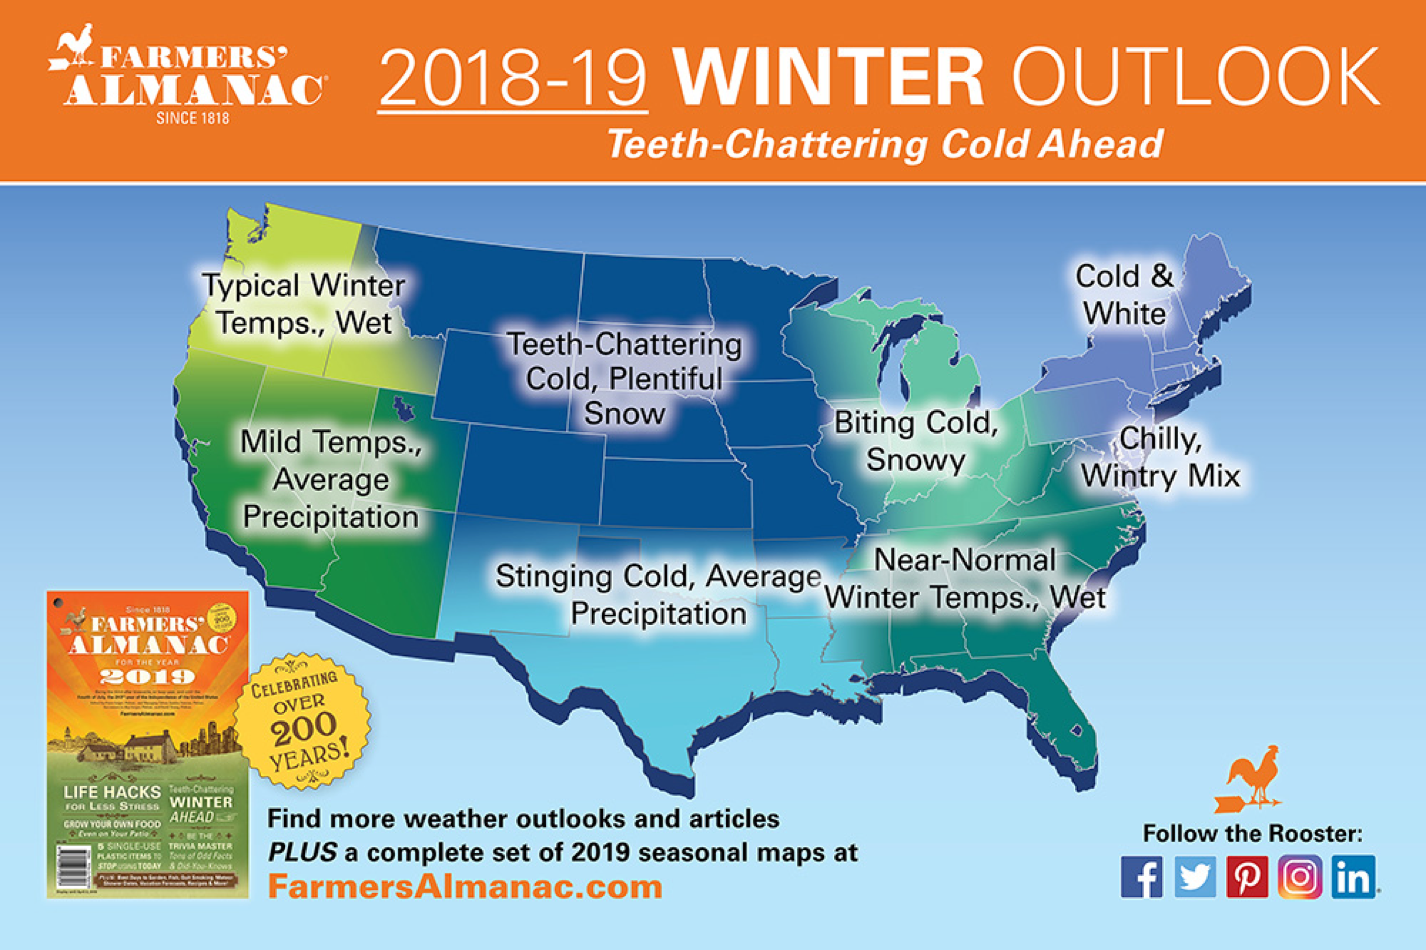
Both the 2019 Farmer’s Almanac and the 2019 Old Farmer’s Almanac show forecast maps that paint a better-looking picture for a snowier winter in these here parts.
The Farmer’s Almanac keeps the Pacific Northwest wet and shows “teeth-chattering cold” with “plentiful” snow over Wyoming. Their map below…..
The Old Farmer’s Almanac has Idaho & Wyoming sitting under “mild and snowy” conditions for the winter. Their map below….
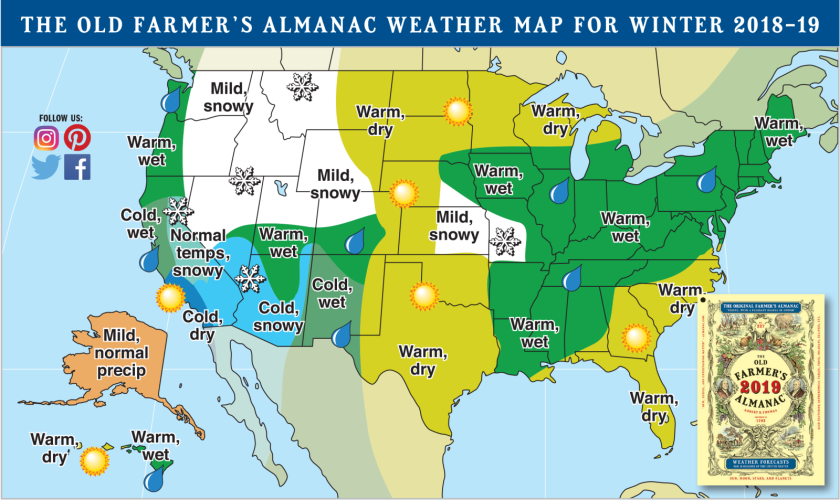
That sounds more like what we are looking for, don’t you think?
Posted by meteorologist Jim Woodmencey
Some of the content used in this post first appeared in the Jackson Hole News & Guide on December 5th, 2018.
Fresh Snow Coming
Finally, a change in the weather pattern after a week of High-pressure for Jackson Hole and a good portion of the Northwestern U.S.
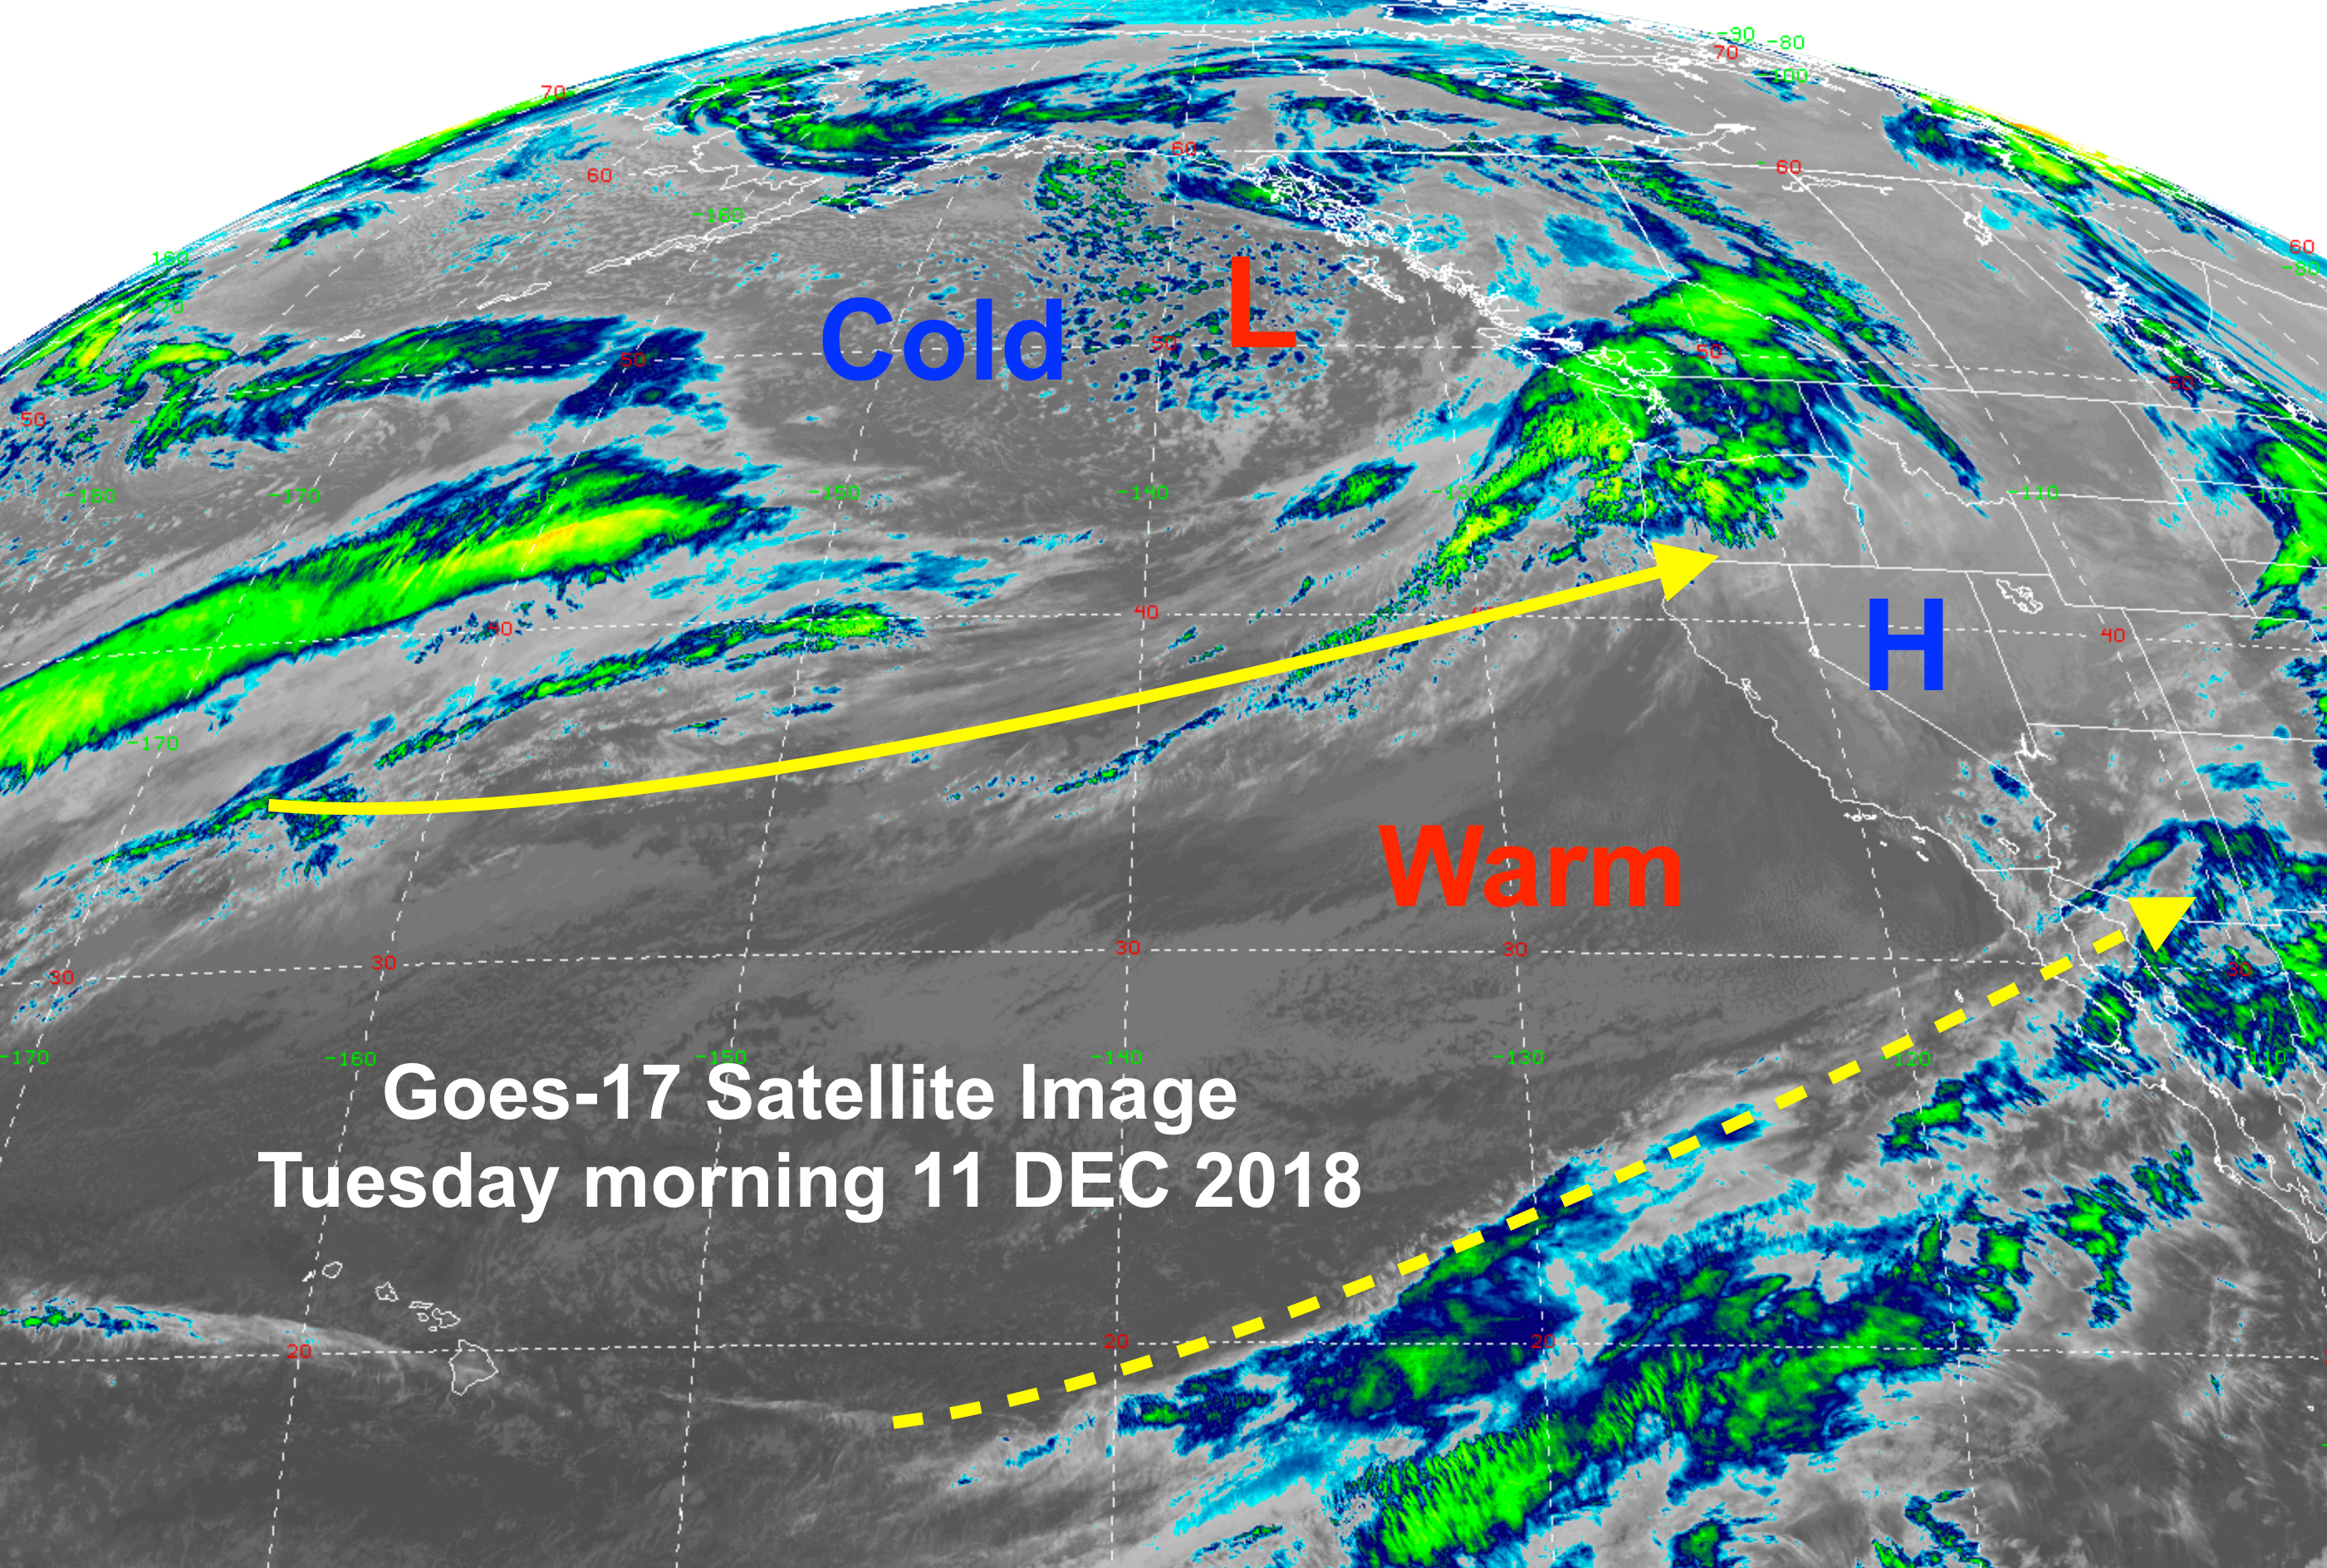
A cold Low-pressure system is moving into the Pacific Northwest today (Tuesday December 11, 2018). This will bring significant snow & wind to the Cascades & southern BC today & tonight.
That system will roll across the Northern Rockies Tuesday night & Wednesday morning, dropping what’s left over Idaho’s Sawtooth & Wyoming’s Teton mountains.
Map below show new GOES-17 Satellite image from Tuesday morning. Location of Low-pressure off the Northwest Coast and the two jet streams coming out of the Pacific northern & southern branches. The norther branch is stronger and it will be carrying this relatively fast moving weather system inland.
Below are a couple of snowfall forecast maps covering Total Snowfall from Tuesday@ Noon to Wednesday @ 3 PM, MST.
For the Tetons & JH: Strong Westerly flow over the Tetons tonight, transitions to a strong Northwesterly flow Wednesday. this could boost sno accumulations to between 8 & 10 inches during this time period, at the 9,000 to 10,000-ft. elevation. Expect more like 3 to 5 inches in the valley.
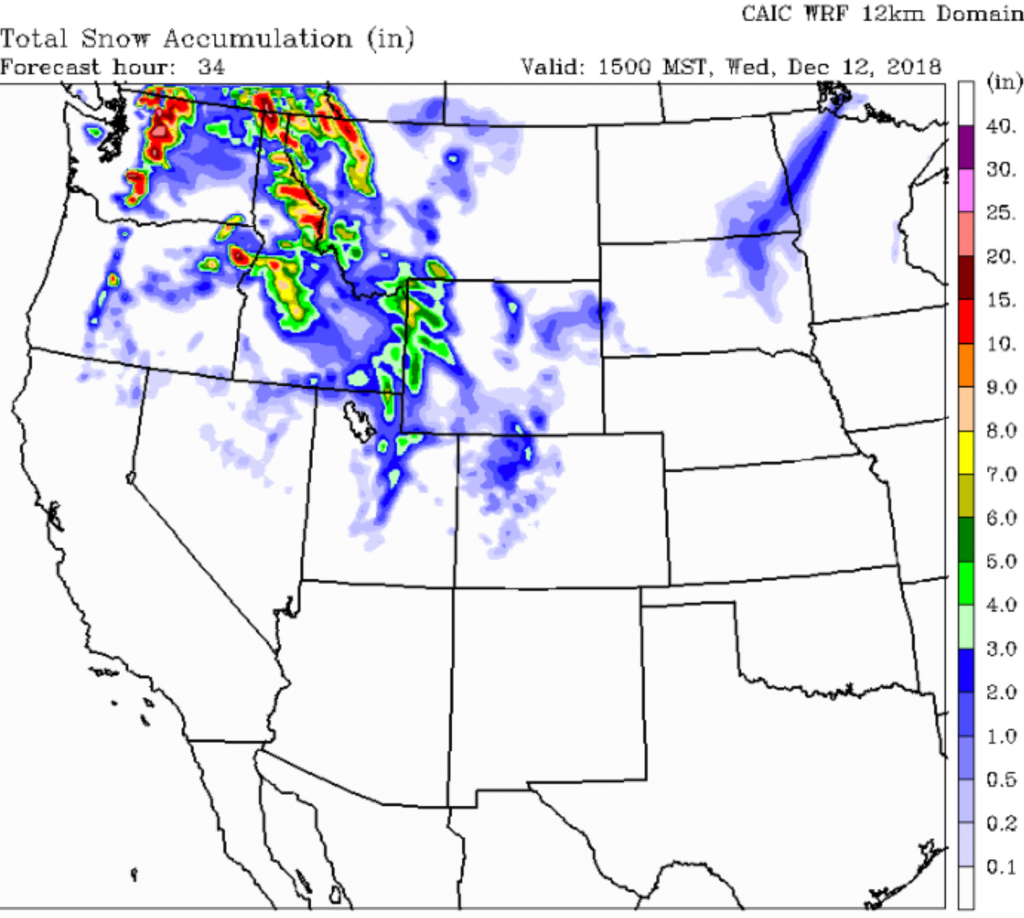
Another model’s prediction….
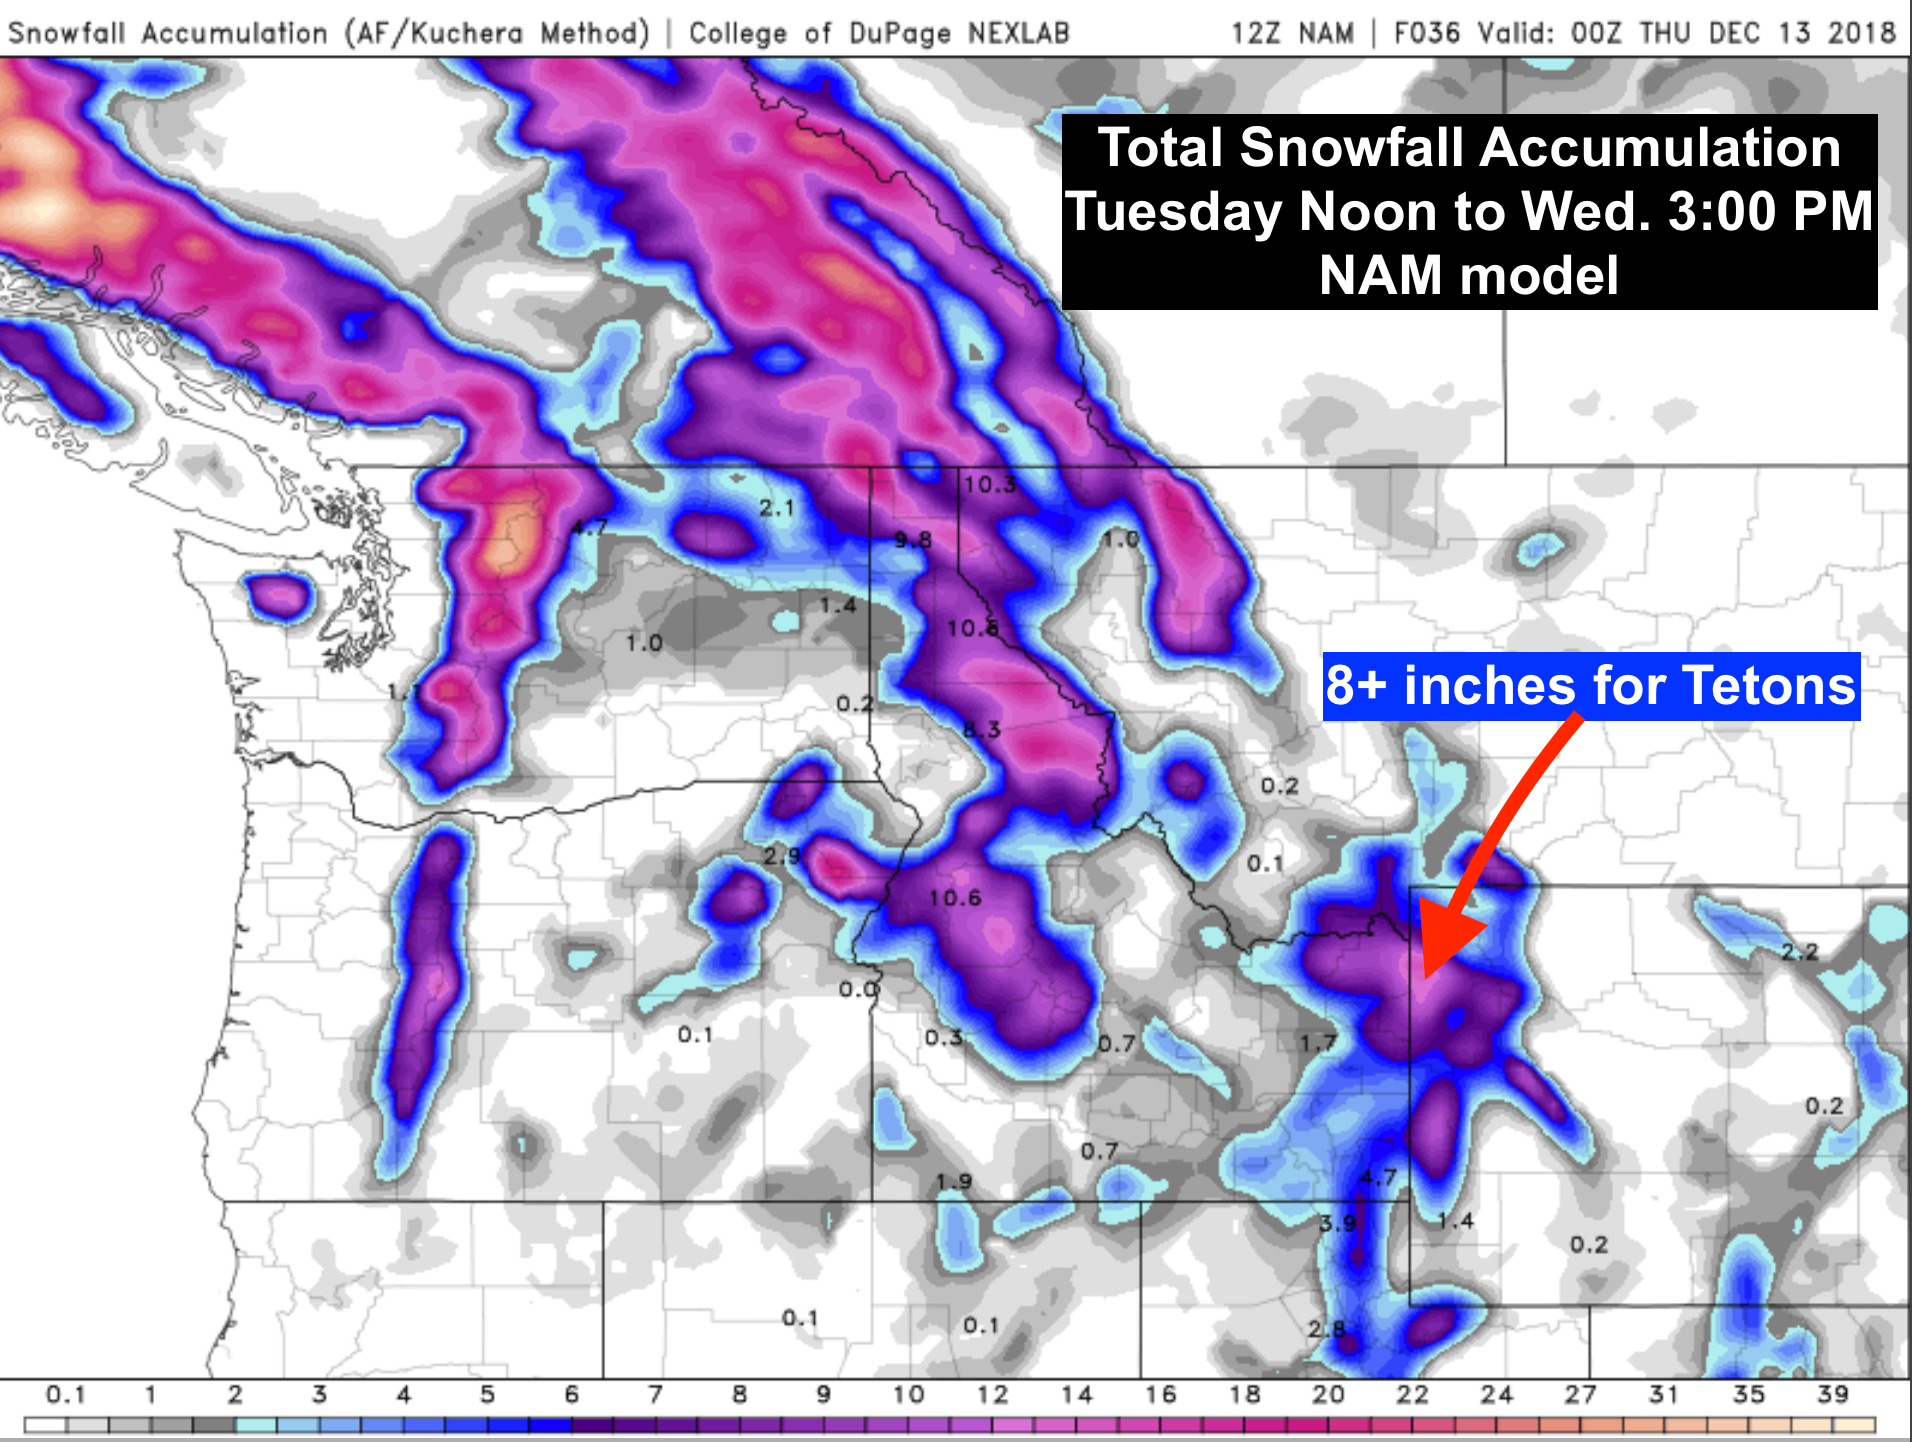
Extended Look: Much colder air aloft arrives for Wednesday. Snow tapers off Wed. afternoon. Warming occurs Thursday afternoon into Friday as a Ridge of High pressure builds inland over the West. Then it looks like another cold, Low-pressure system moves into the Pacific Northwest later Friday, bringing the Tetons a little more snow over the weekend.
Post by meteorologist Jim Woodmencey
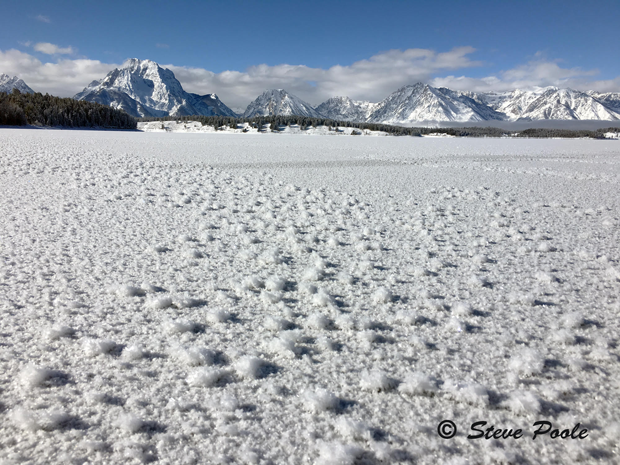
Frosty Jackson Lake
Snow: First Days of December
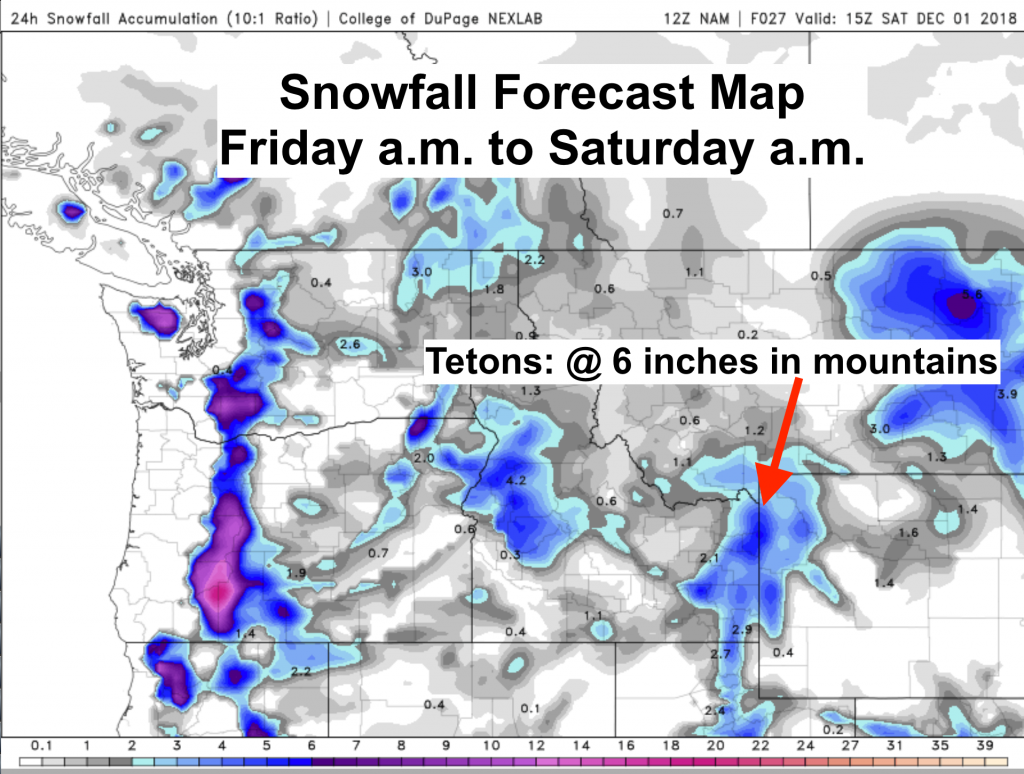
Some Snow for the Tetons
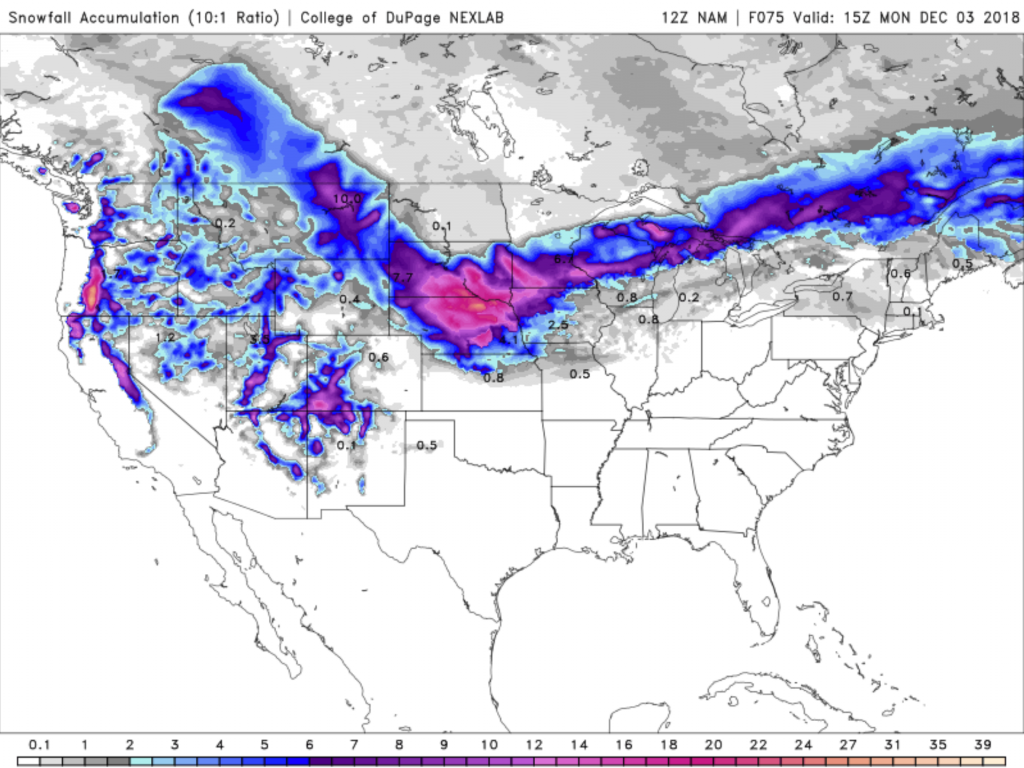
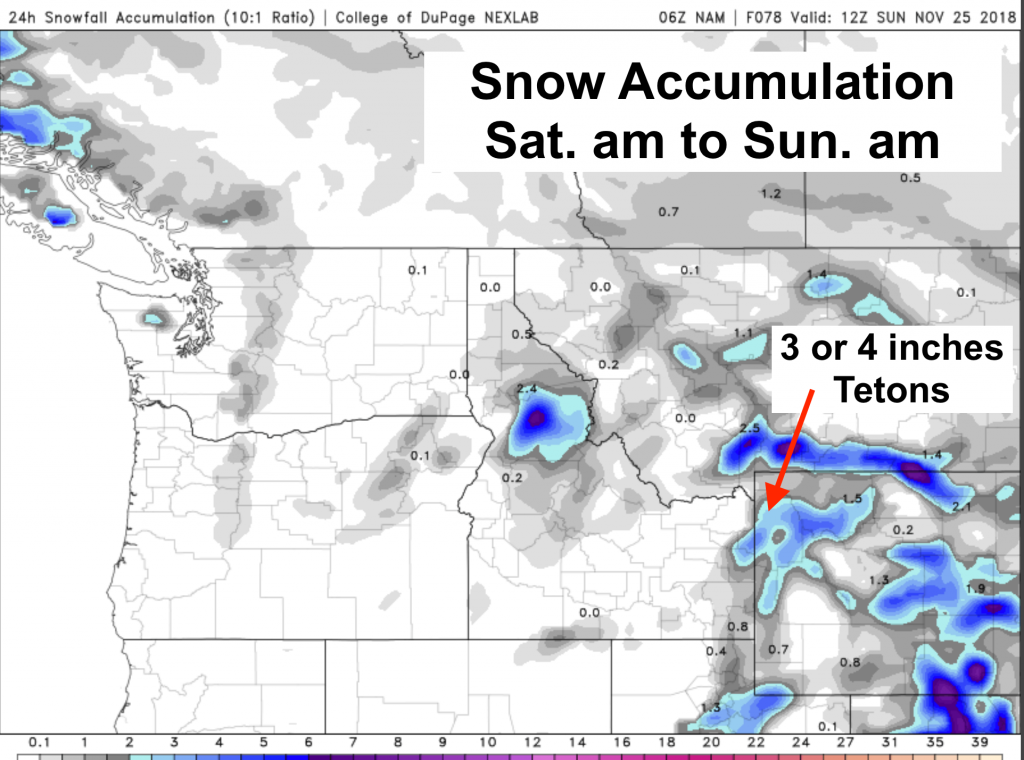
Total snow accumulations predicted for today (Friday) thru Saturday morning for the Teton mountains are between 6 and 10 inches. See map below from the NAM model run by NexLab. Click on the next map to see a loop of accumulating snow from 8 am today thru Noon Saturday, from CAIC WRF model (Colorado Avalanche Information Center).
This snow comes from second Low-pressure center that moves over the Pacific Northwest, then weakens and hangs out over the Rockies this weekend. This Low will also bring much colder air aloft over the northern & central Rockies this weekend.
Just enough moisture for clouds & some light snow showers hanging around the mountains Sunday into Monday. Do expect some brief breaks in the clouds with this very weak upper level flow. (Keep scrolling down for more Regional & National info)
Click on map below for a loop of snow accumulation thru Saturday at Noon.
This model shows the Teton Range accumulating 10 inches+ at the higher elevations, including what already fell prior to 8 am Friday.
Look at the Bigger Picture
Slow moving weather systems across the United States will be the rule through the first weekend of December. Along with a jet stream that remains over the southern portion of the U.S.
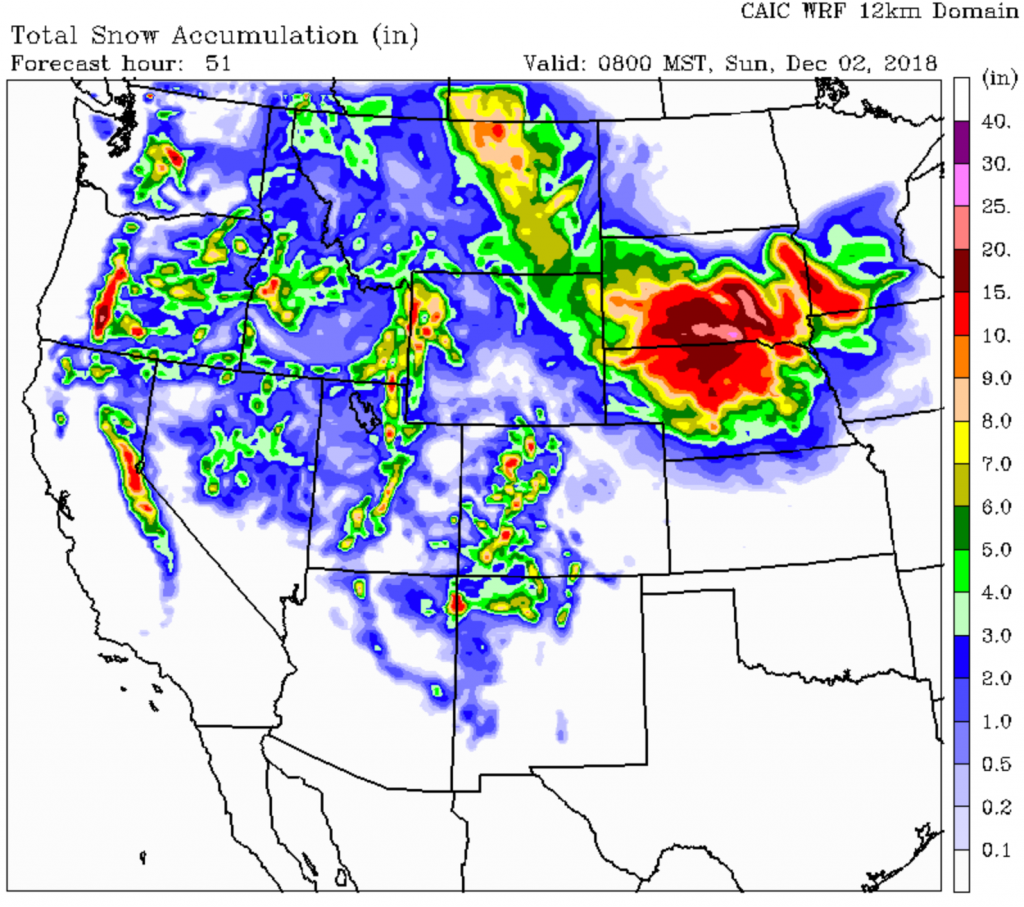
Map below shows total snow accumulations from Friday morning Nov. 30th through Monday morning December 3rd, 2018, across the entire Continental U.S.
Biggest accumulations over the southern Cascades around Crater Lake, and also Southwestern Colorado’s mountains around Telluride and Wolf Creek Pass.
In Nebraska too, but the skiing there is kinda flat!
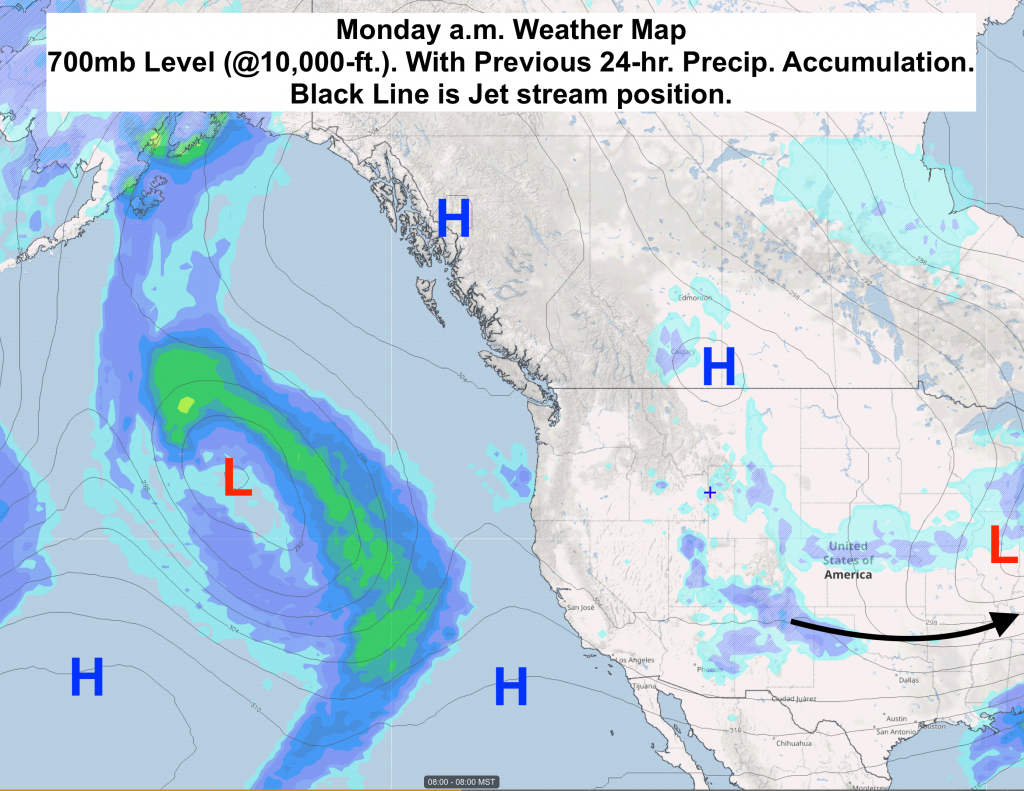
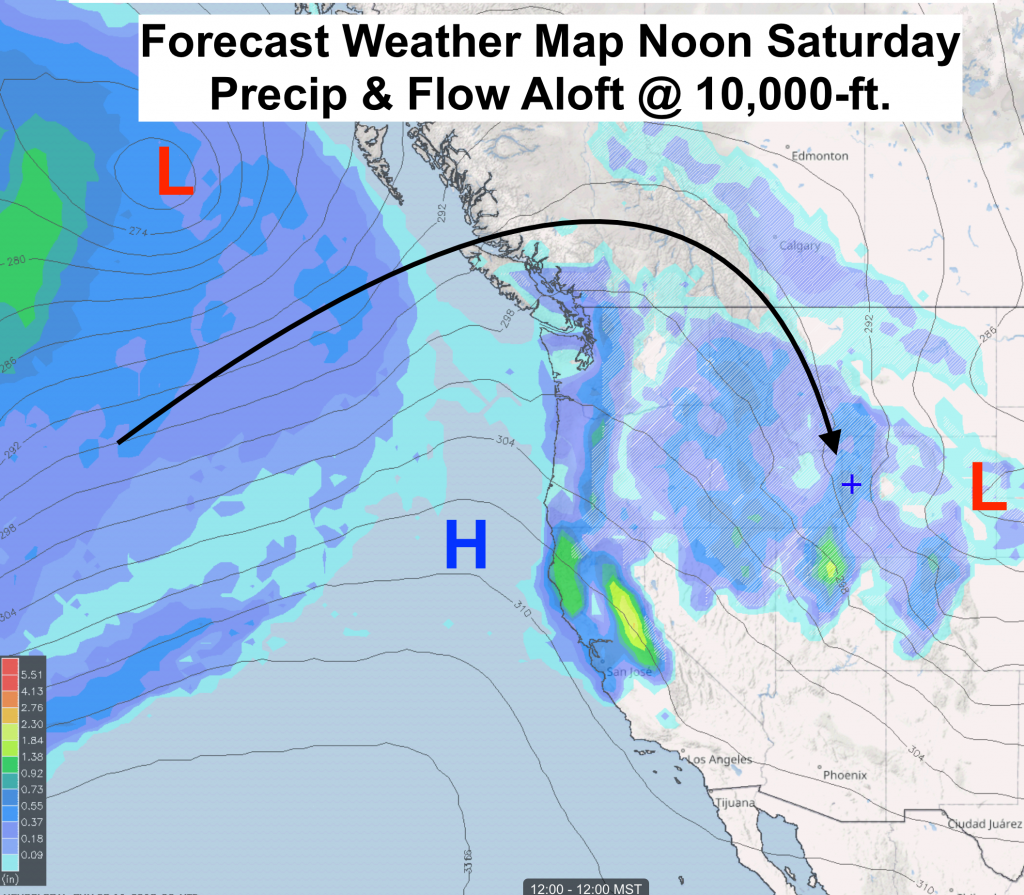
Below are the forecast weather maps for Saturday, Sunday & Monday morning. These maps are for the 700mb level or around 10,000-ft. in the atmosphere.
Positions of High & Low pressure & the Jet Stream are plotted on the maps.
The previous 24-hours of precipitation are also shown.
(+ marks the Jackson Hole Mountain Resort)
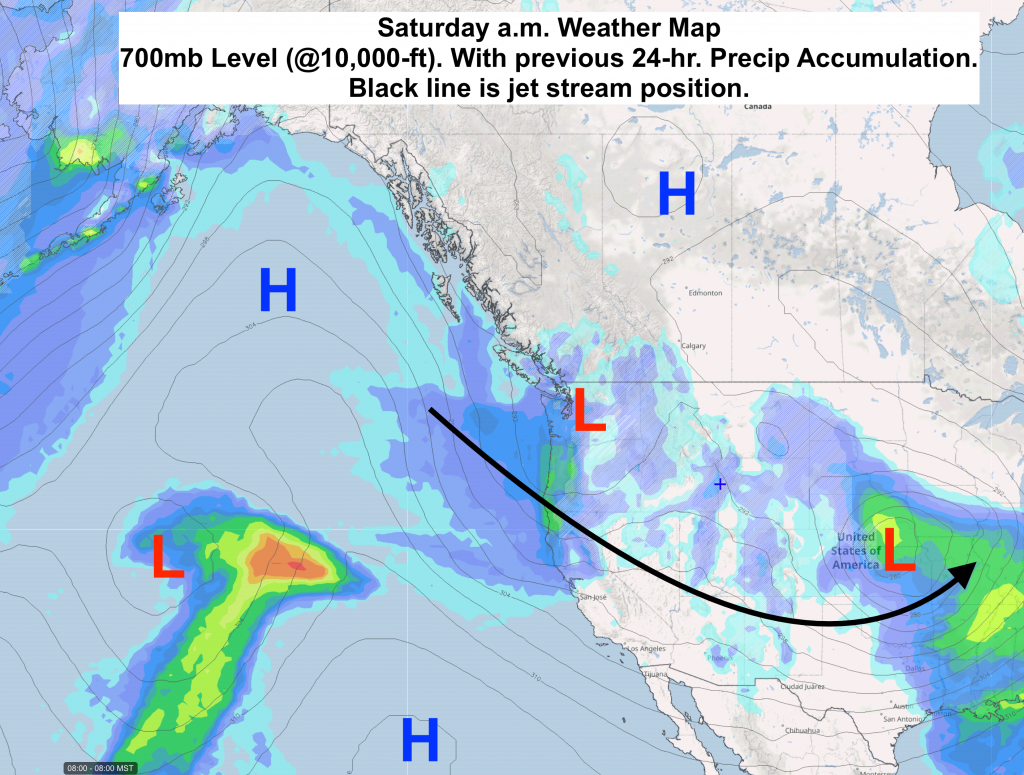
Faint gray lines on these maps show the pressure pattern at this level. Where the lines are close together it is windier. Farther apart, it is less windy.
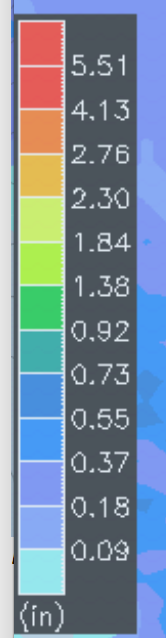
Here is the precip scale in inches of water to use for these maps:
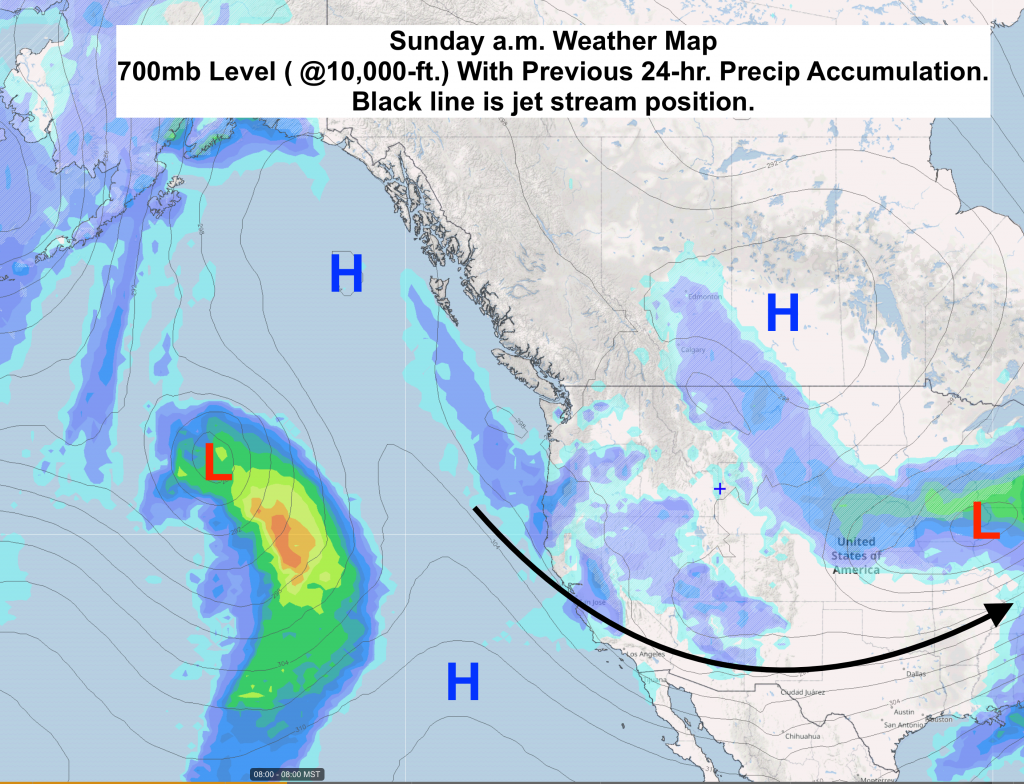
Jet stream dipping further south and pulling further eastward by Monday.
Winds aloft near ridgetop level are about as light as they get for Sunday & Monday over the entire western U.S. Precipitation also tapers off in most areas.
Post and analysis by meteorologist Jim Woodmencey
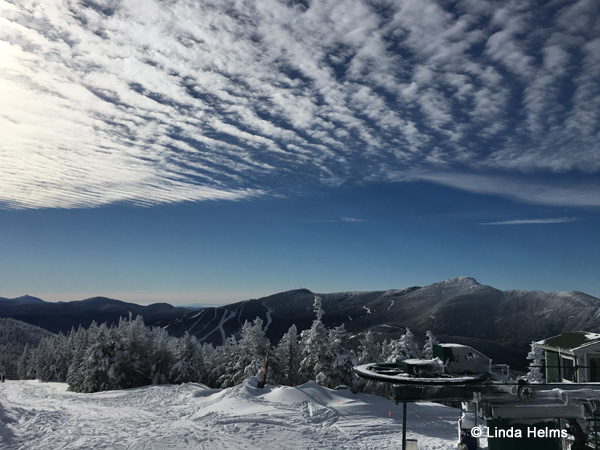
Vermont
Thanksgiving Weekend Snow
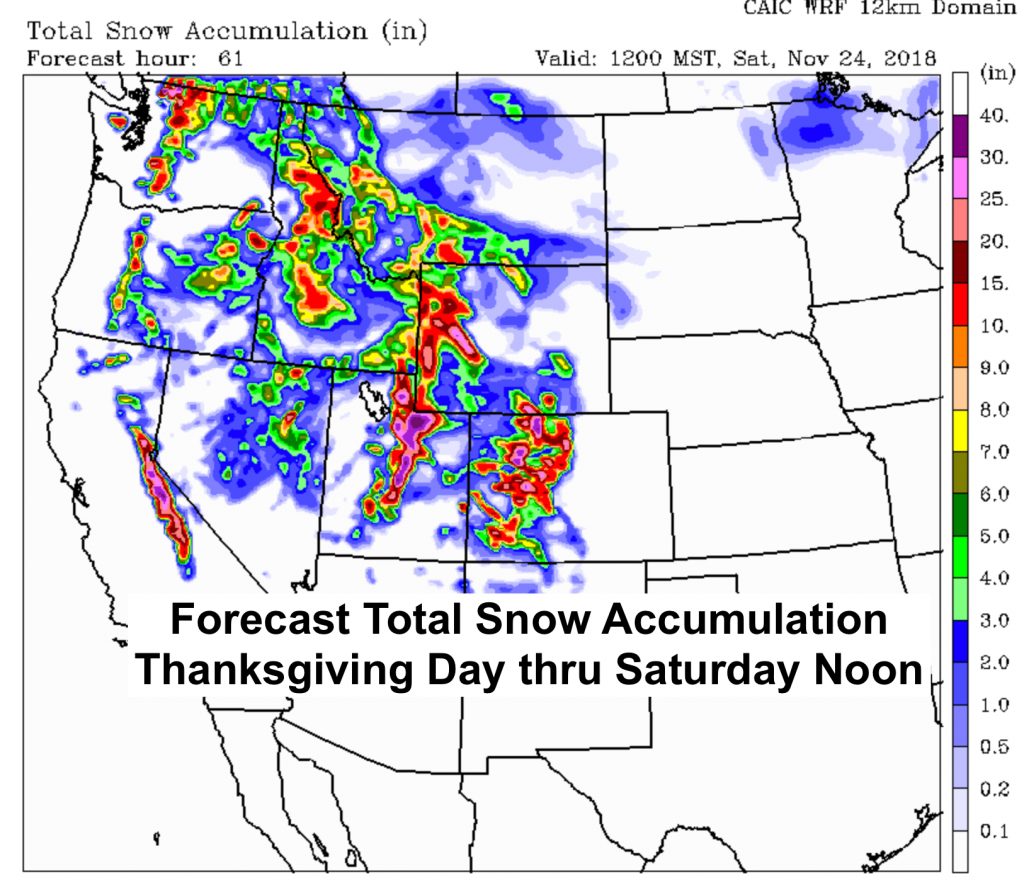
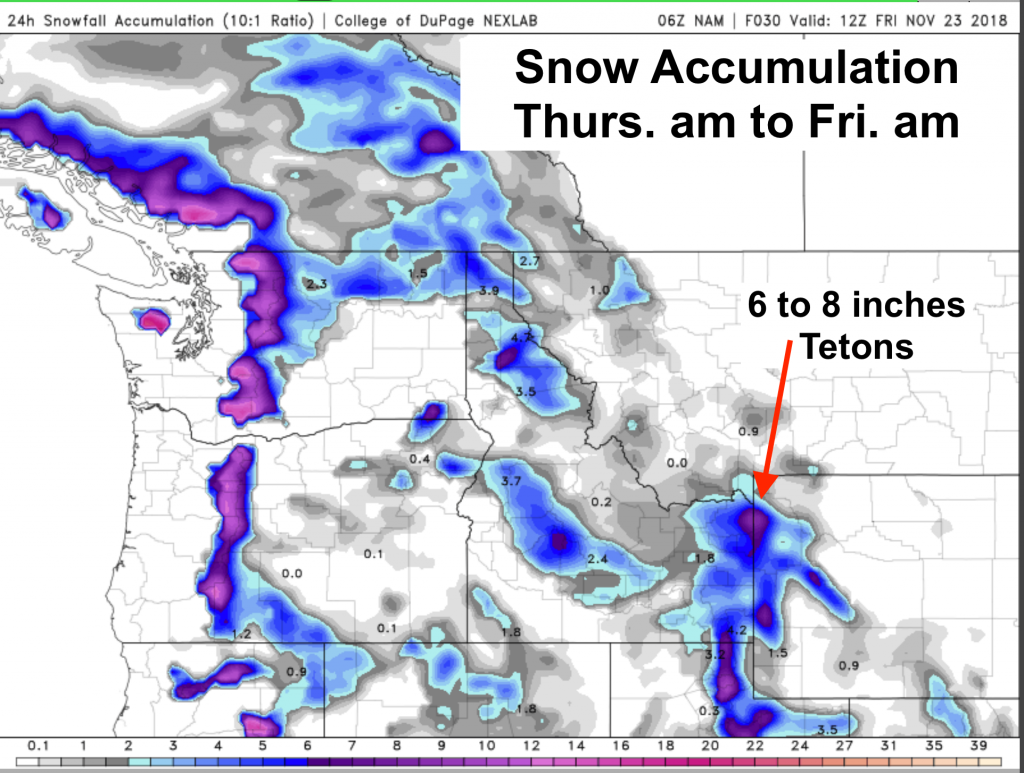
Low pressure systems out in the Gulf of Alaska and along the West Coast will bring moisture inland across the Western United States on Thanksgiving Day and into the weekend. Expect some decent snow accumulations from the higher Cascades and Sierra Nevada Mountains to the Tetons of Wyoming & Wasatch of Utah and also into Central Colorado’s mountains.
Click below to watch the loop of snow accumulation from Thanksgiving morning thru Saturday morning, November 22nd to 24th, 2018.
Read on for a breakdown of what’s causing the weather, and snow & water accumulations day by day. With a focus on snow accumulations in the Teton Mountains. Good news for opening day at the Jackson Hole Mountain Resort!
Weather Pattern for Thanksgiving Weekend Snow
Thanksgiving Day: A Southwesterly flow Thursday transitions to a strong Westerly flow aloft over the Western U.S Thursday night to Friday, eventually bending to more of a Northwesterly flow by Saturday.
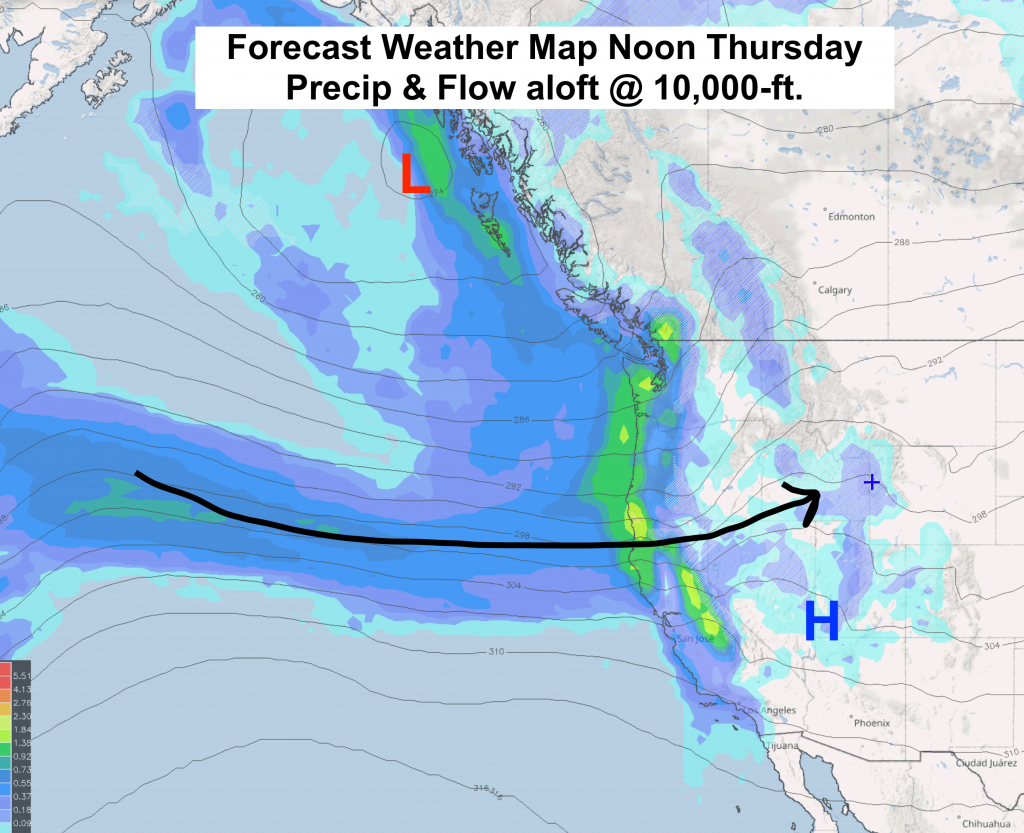
For the Teton area of Wyoming, temps warm a bit early Thursday before cooling down later Thursday with the first wave coming in from the Pacific.
Friday: It will warm enough Friday afternoon for some rain possibly mixing with snow at lower elevations in that strong westerly flow.
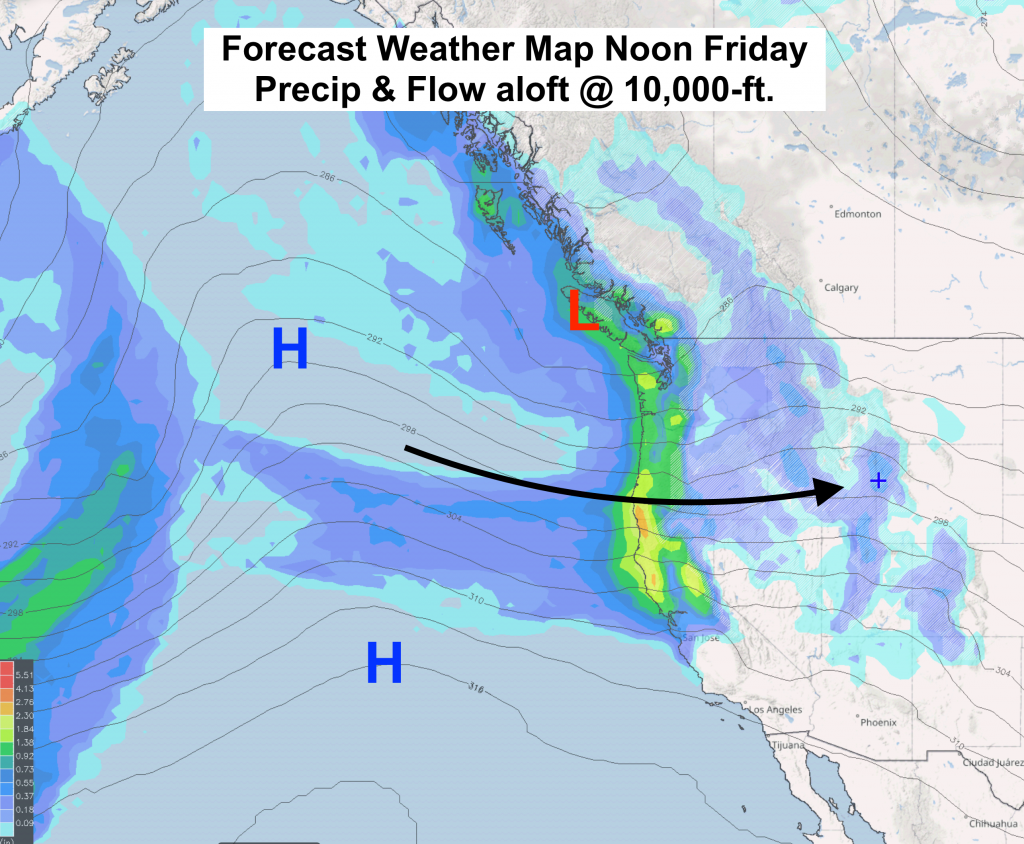
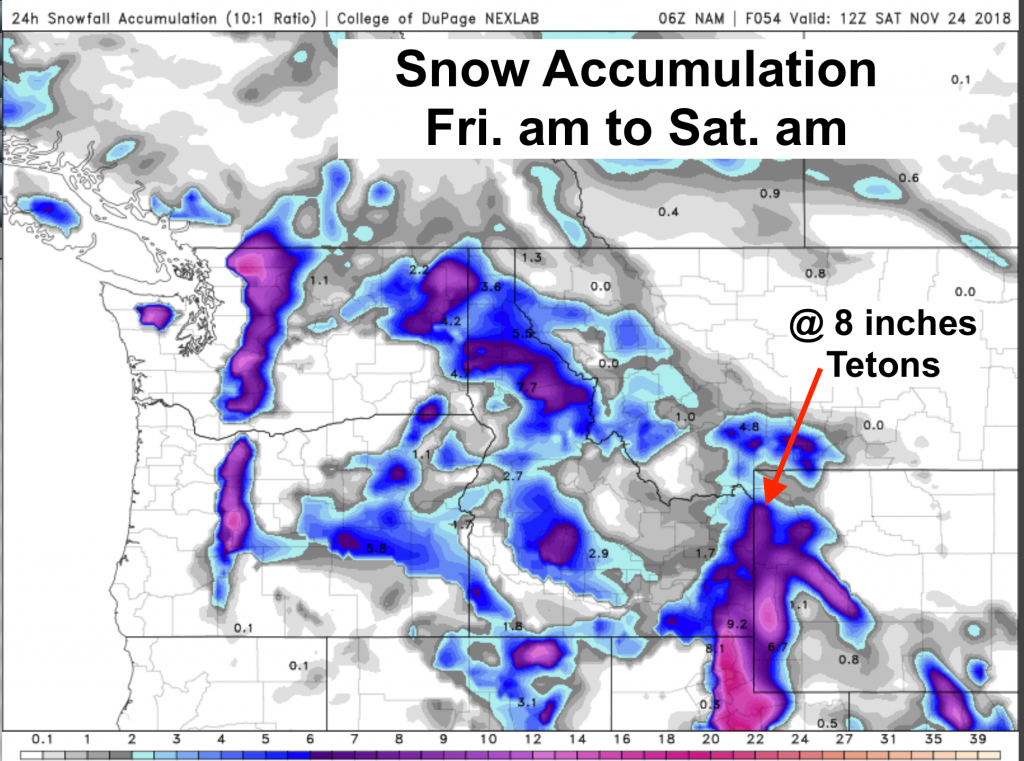
Saturday: Much colder temps coming Friday night into Saturday as the flow aloft turns to a more North-NW direction. Precip tapers off later Saturday and it looks drier & cooler for Sunday.
Happy Thanksgiving Powderhounds!
Posted by meteorologist Jim Woodmencey
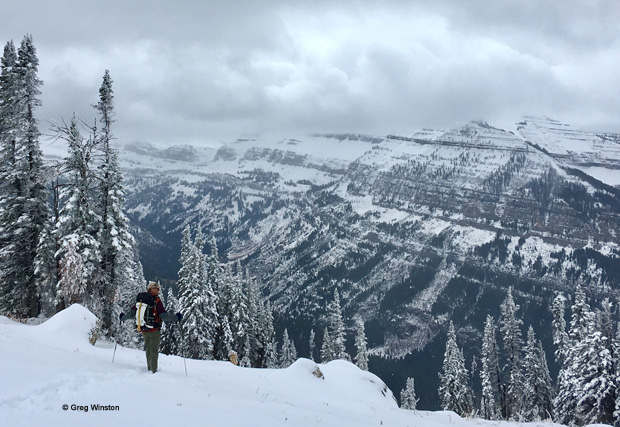
Teton Canyon Snow
More Snow for the Mountains
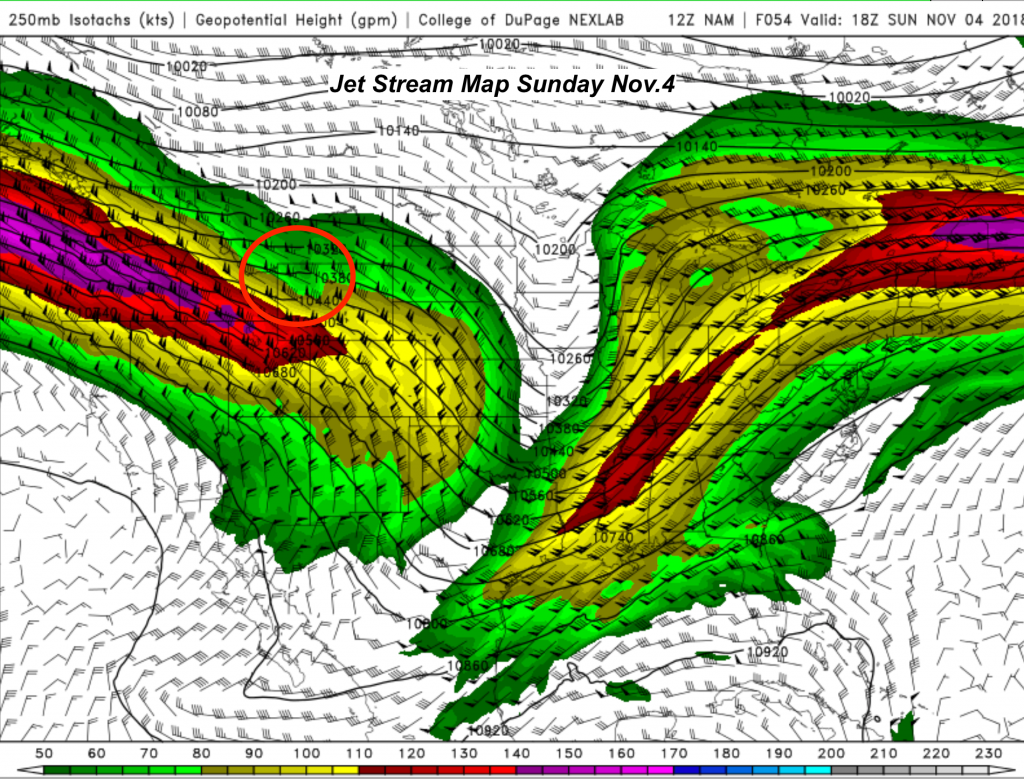
A pretty good flow of Pacific moisture will be blowing inland across the Pacific Northwest this weekend, with progressively cooling temperatures (Nov. 3 & 4). Best shot of snow looks like it will come right at Northwest Wyoming Sunday & Sunday night.
Map below shows the nose of the jet stream at 250mb or 35,000-ft. positioned just south of Jackson Hole. Winds of 100 mph+ over NW Wyoming.
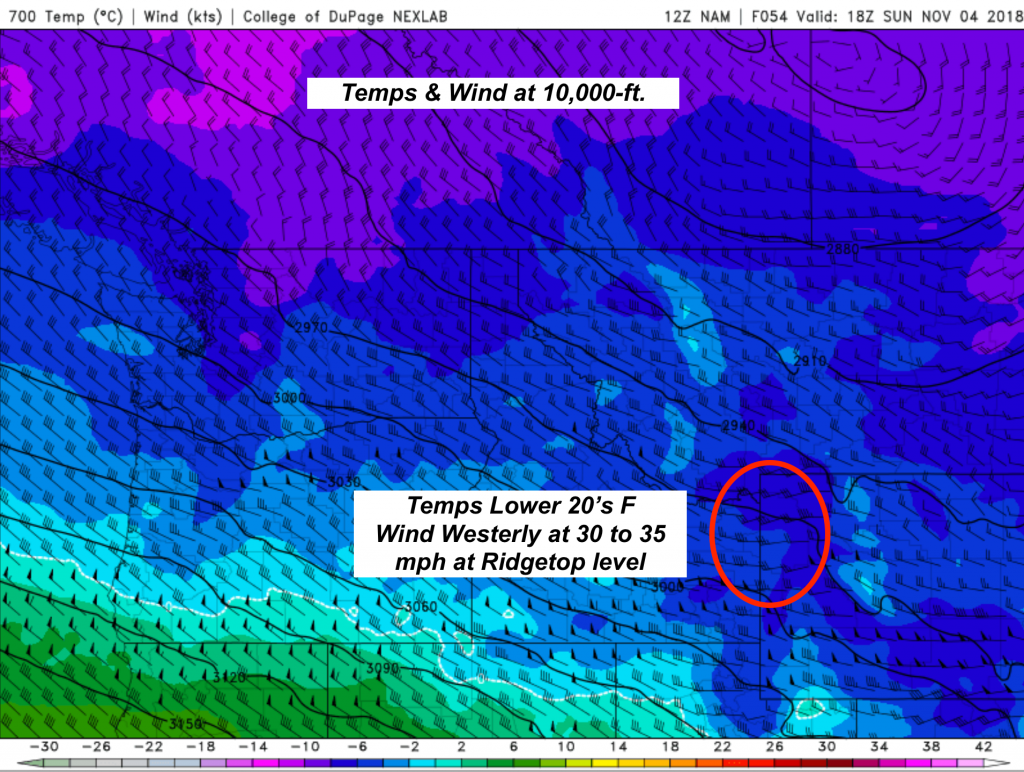
Map below shows the 700mb temps and wind speeds, near the 10,000-ft. elevation. Should be cold enough for snow to valley floor Sunday also.
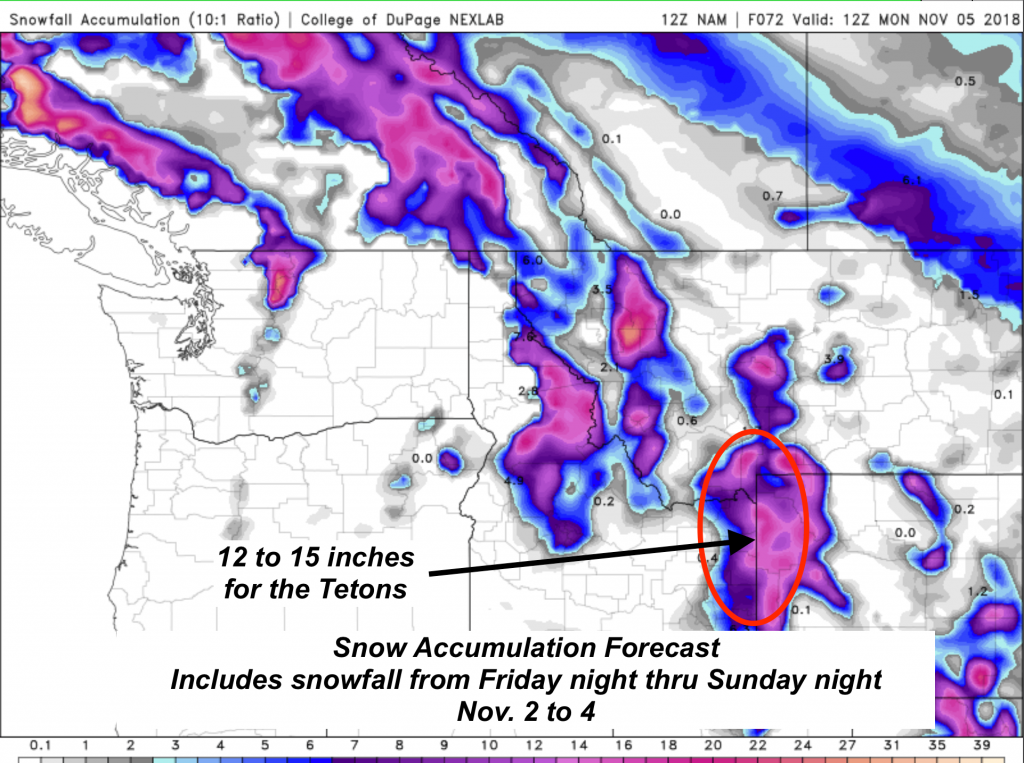
Map below shows Total Snowfall forecast from Friday evening thru Sunday night.
Post by meteorologist Jim Woodmencey