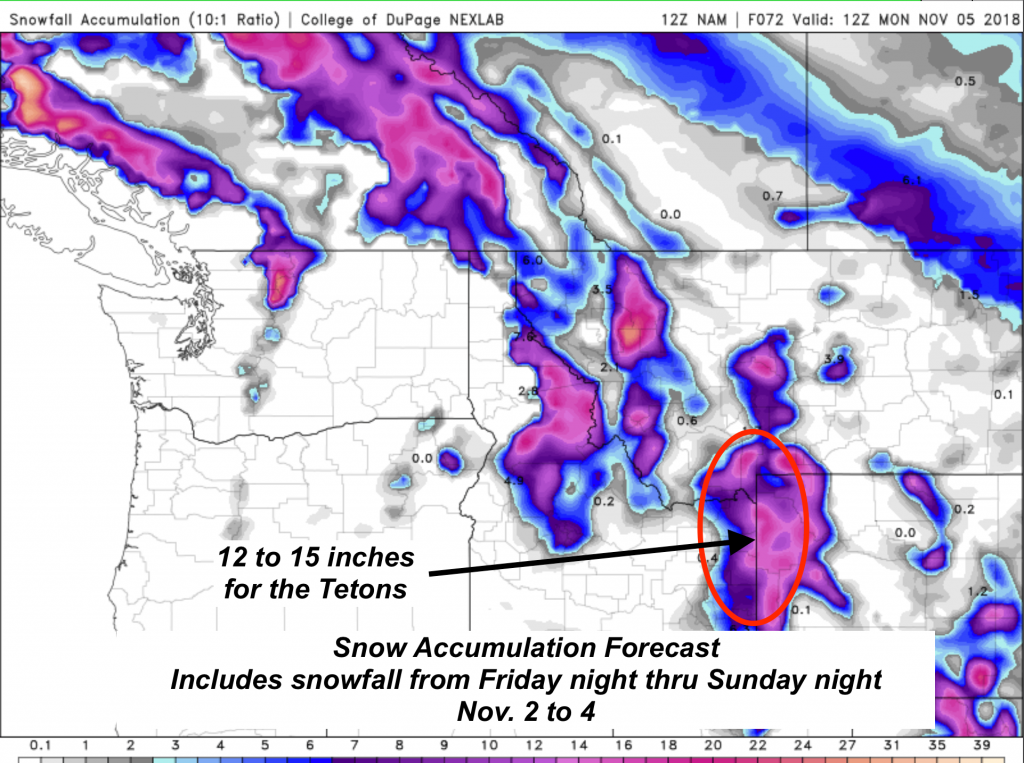
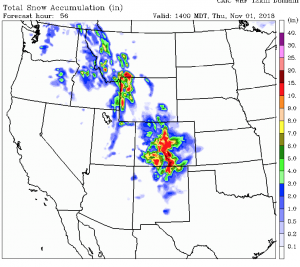
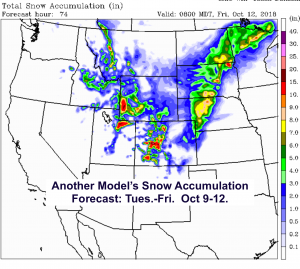
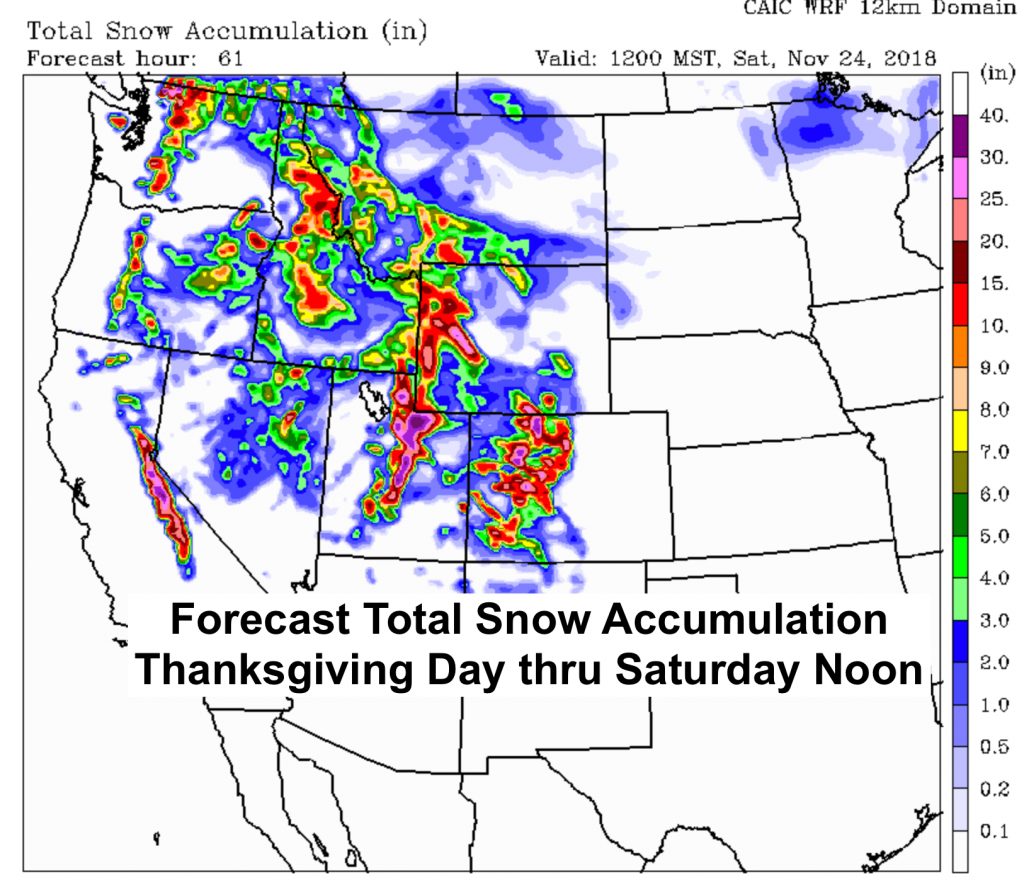
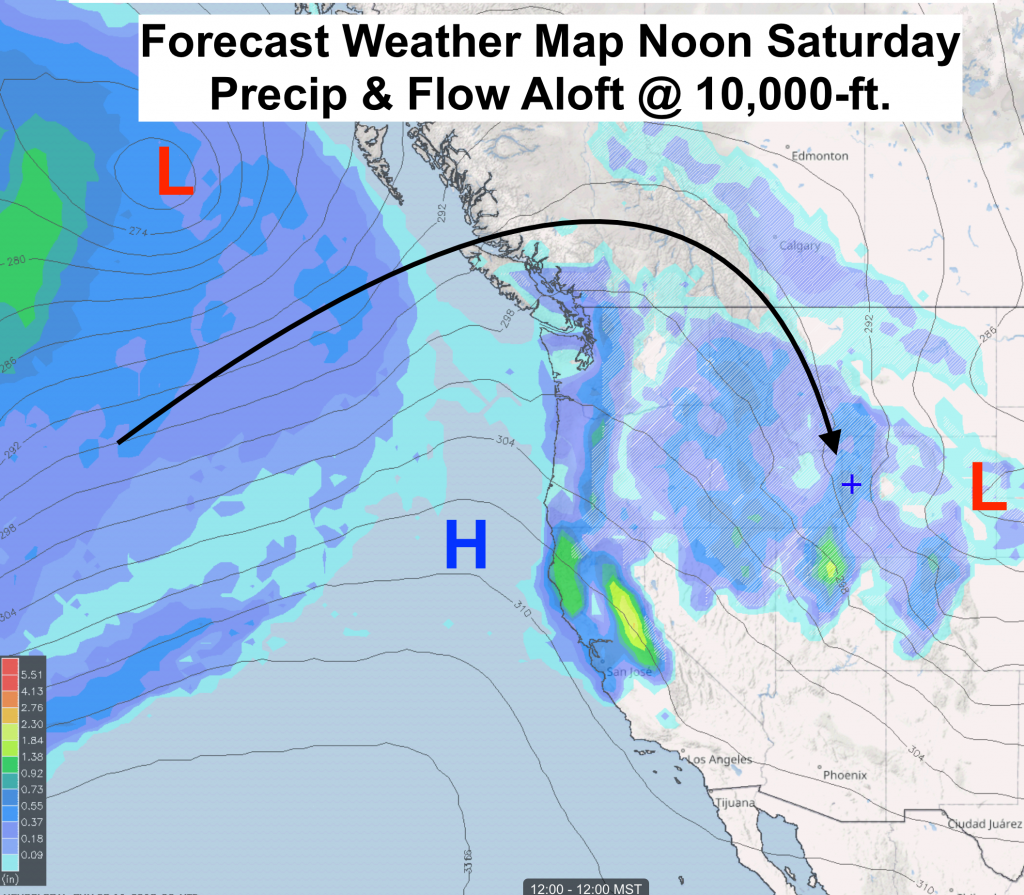
Low pressure systems out in the Gulf of Alaska and along the West Coast will bring moisture inland across the Western United States on Thanksgiving Day and into the weekend. Expect some decent snow accumulations from the higher Cascades and Sierra Nevada Mountains to the Tetons of Wyoming & Wasatch of Utah and also into Central Colorado’s mountains.
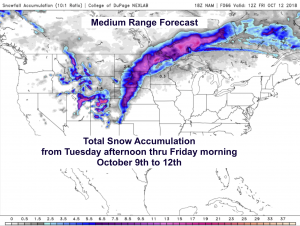
Click below to watch the loop of snow accumulation from Thanksgiving morning thru Saturday morning, November 22nd to 24th, 2018.
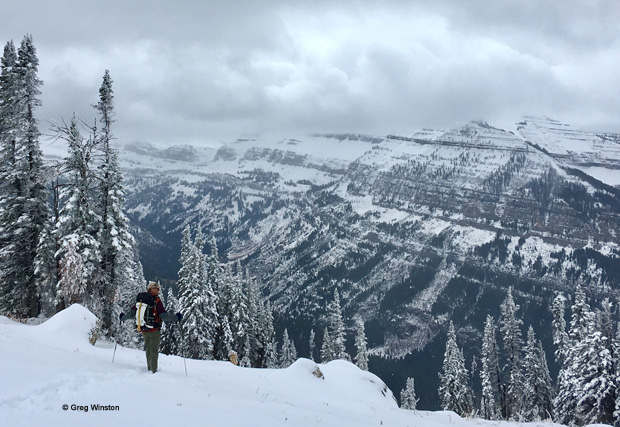
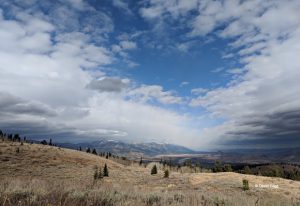
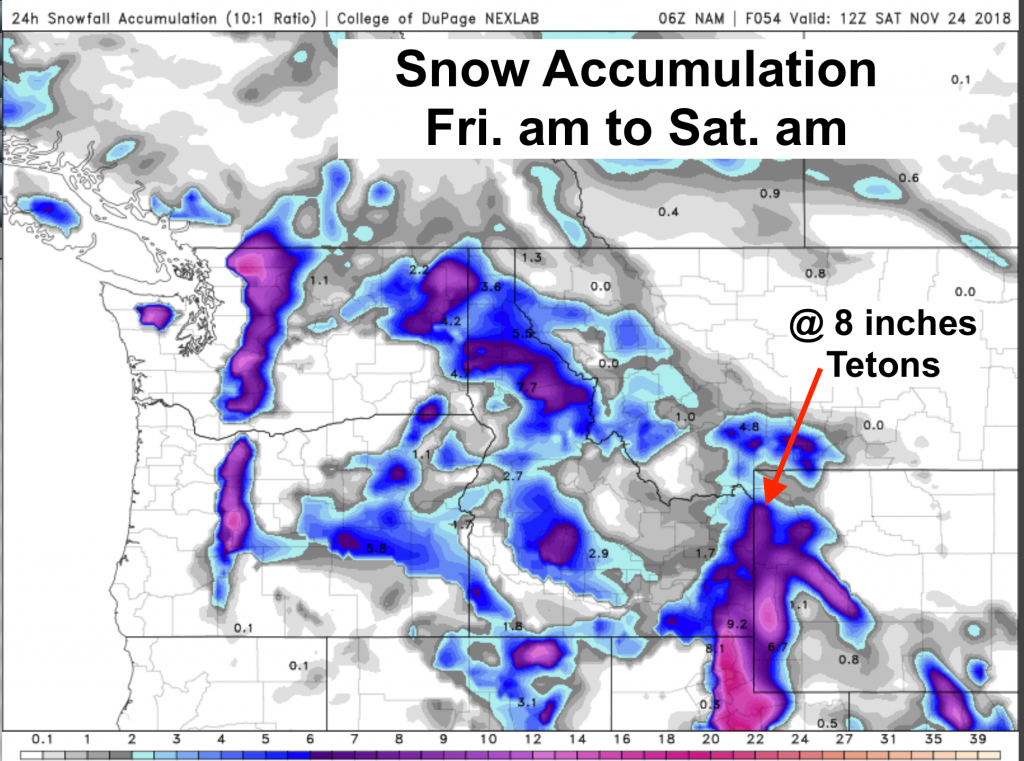
Read on for a breakdown of what’s causing the weather, and snow & water accumulations day by day. With a focus on snow accumulations in the Teton Mountains. Good news for opening day at the Jackson Hole Mountain Resort!
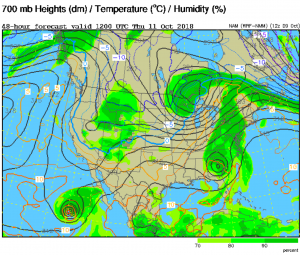
Weather Pattern for Thanksgiving Weekend Snow
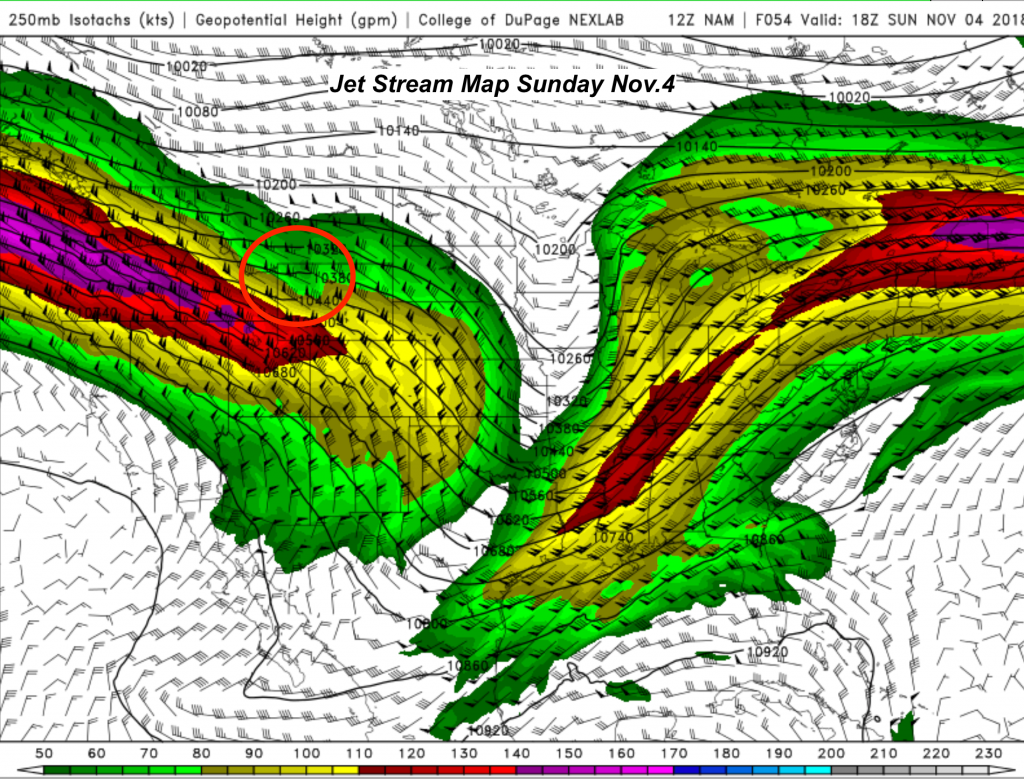
Thanksgiving Day: A Southwesterly flow Thursday transitions to a strong Westerly flow aloft over the Western U.S Thursday night to Friday, eventually bending to more of a Northwesterly flow by Saturday.
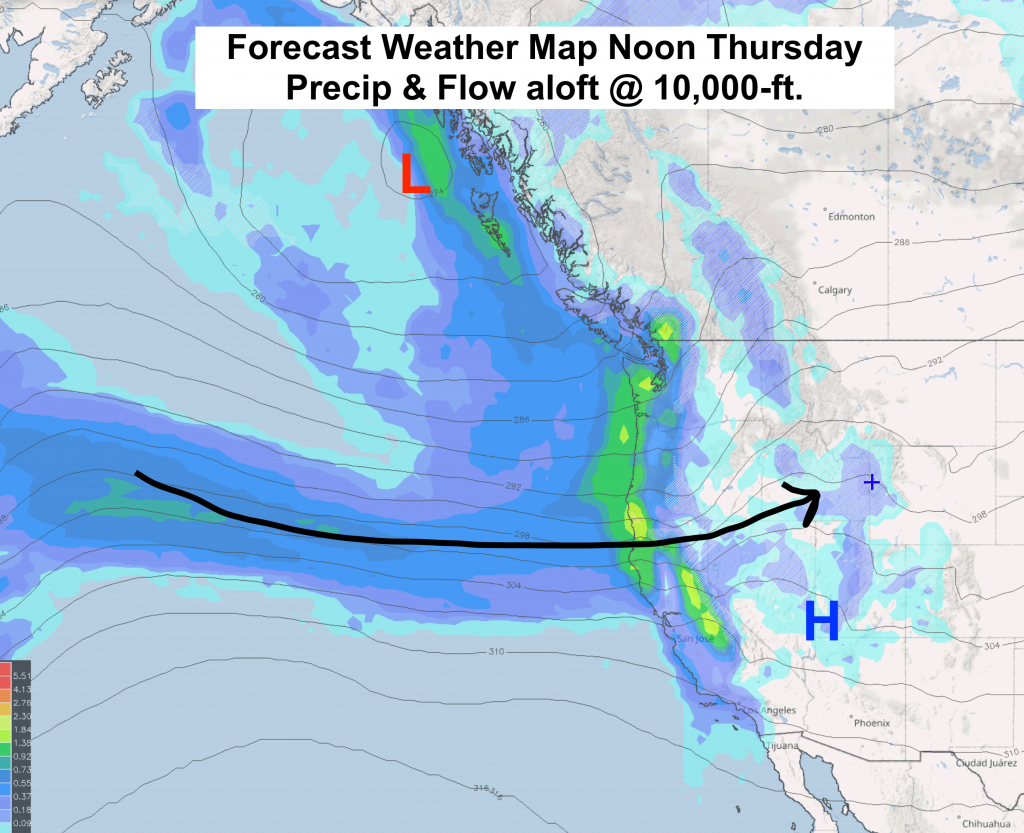
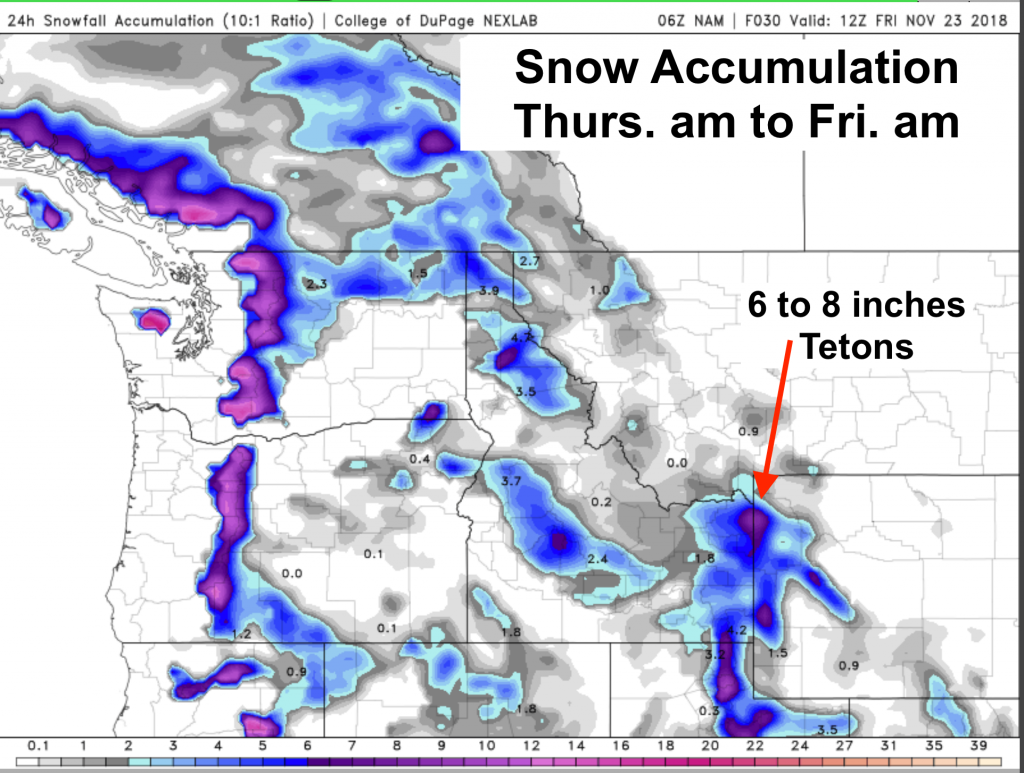
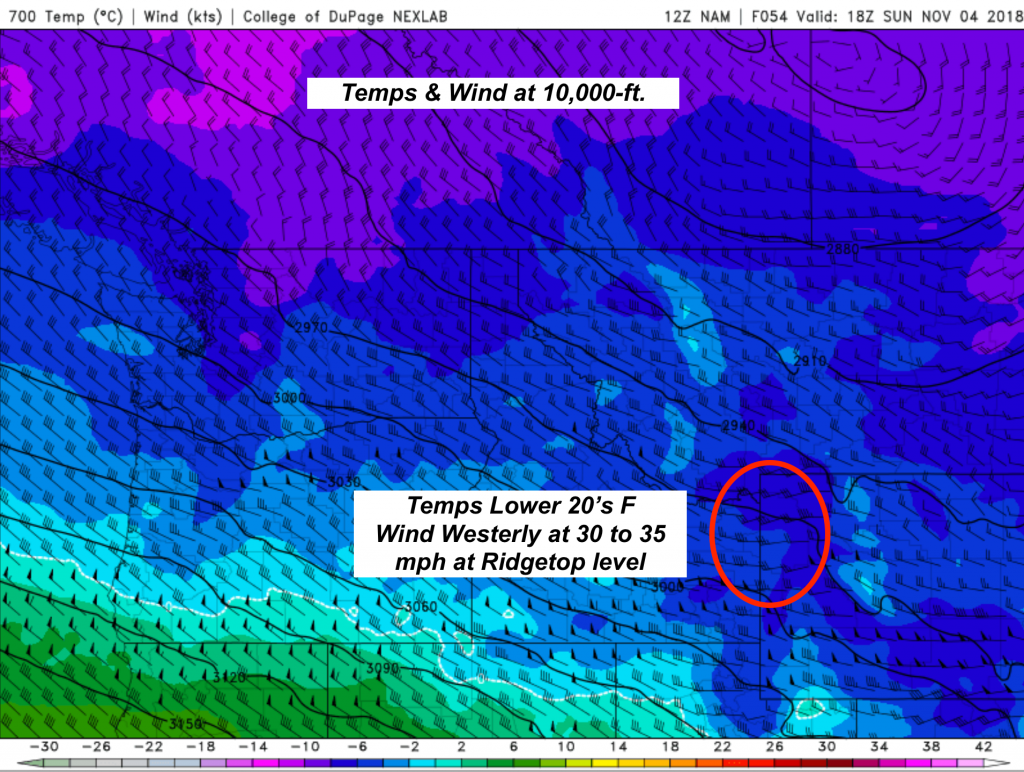
For the Teton area of Wyoming, temps warm a bit early Thursday before cooling down later Thursday with the first wave coming in from the Pacific.
Friday: It will warm enough Friday afternoon for some rain possibly mixing with snow at lower elevations in that strong westerly flow.
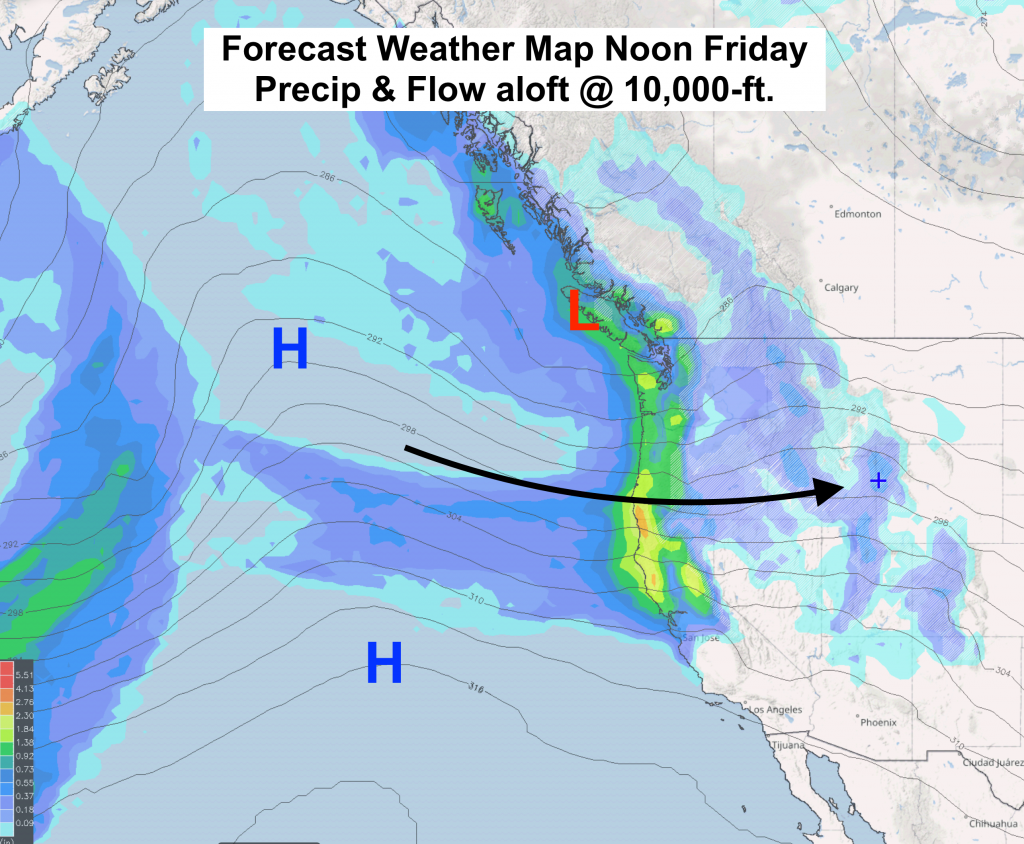
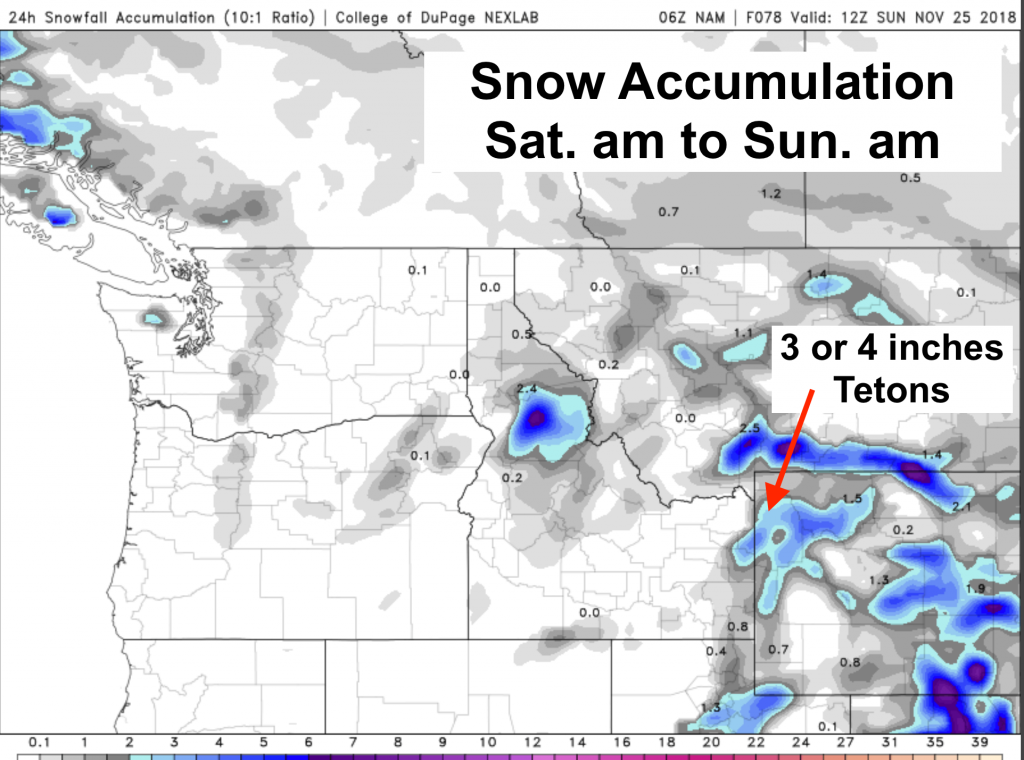
Saturday: Much colder temps coming Friday night into Saturday as the flow aloft turns to a more North-NW direction. Precip tapers off later Saturday and it looks drier & cooler for Sunday.
Happy Thanksgiving Powderhounds!
Posted by meteorologist Jim Woodmencey