

All posts by Jim Woodmencey
Father’s Day Weekend Update
Low-pressure moves inland from the Pacific Northwest Coast and settles in over the Great Basin for the Father’s Day Weekend. More clouds and scattered showers & Thunderstorms will be generated as moist and relatively unstable air is circulated over the Rockies, Friday thru Monday (June 15 to 18).
The flow aloft over western Wyoming and Jackson Hole will be coming out of the South (Southwest to Southeast) this weekend, so be on the lookout for moisture & T-storms generally tracking from those directions, especially over the surrounding mountains.
Forecast of this weekend’s precipitation is shown in the map below. Click the image to run a loop of the accumulating precip amount, every 3-hours, from Friday Noon to Monday Noon, June 15 to 18. (This is just one model’s interpretation, from CAIC).
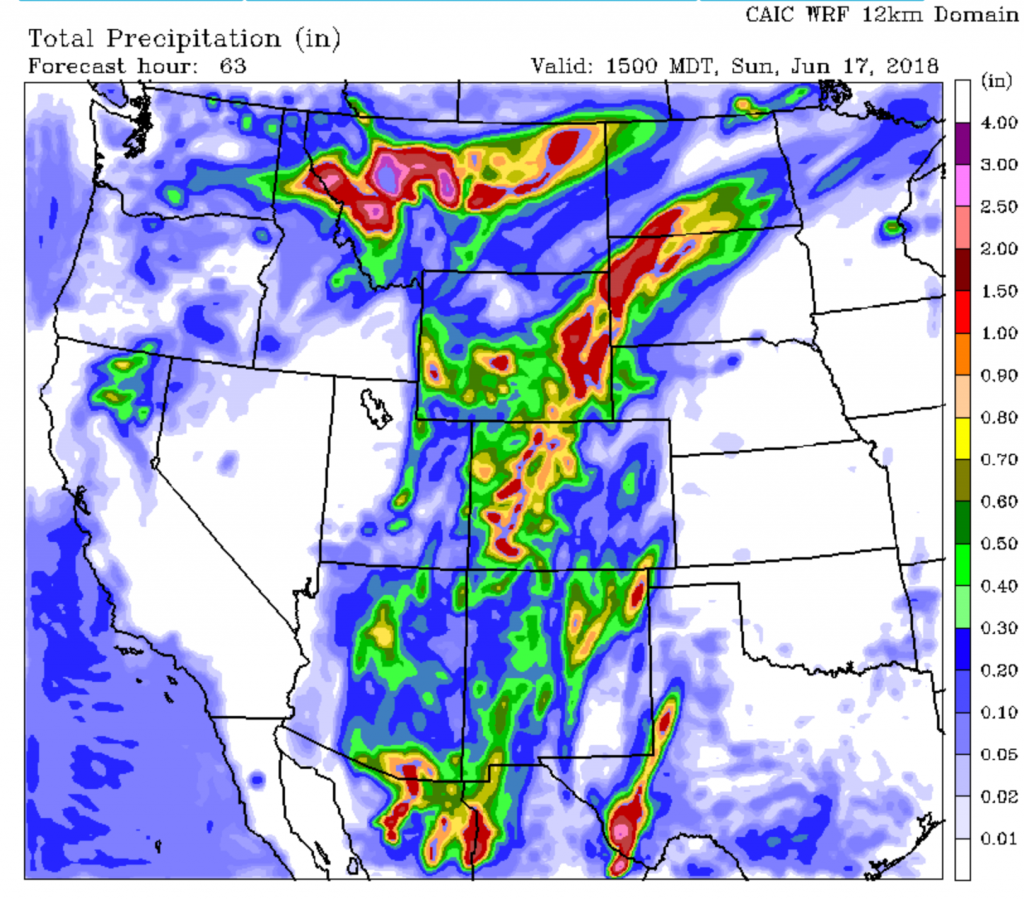
Central & Eastern Wyoming in this model’s prediction seemed to get more precip Saturday night/ Sunday morning. Southwestern Wyoming & the Jackson Hole area seem to get the most precip later Sunday & early Monday.
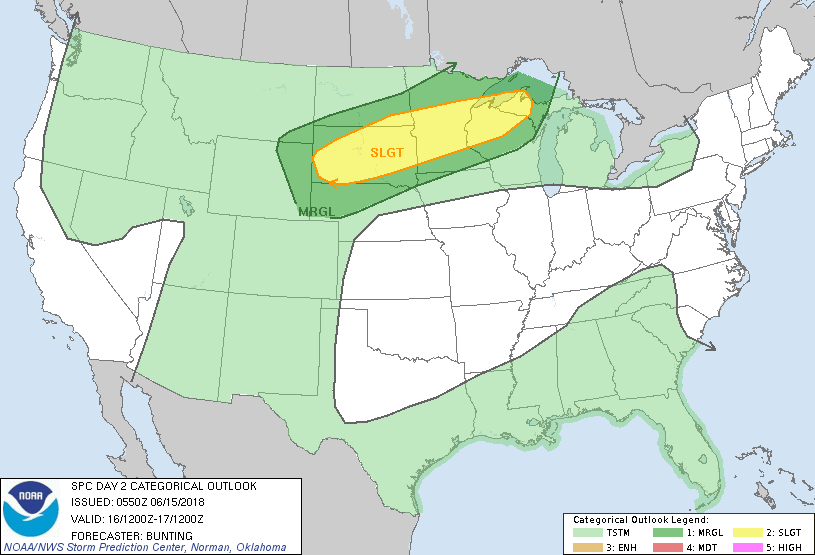
Here are the Convective Outlook Maps for Saturday & Sunday. These maps display areas with a risk of Thunderstorms. Thunderstorm coverage over the Rockies is widespread, but risk of strong thunderstorms is limited to areas east of the Rockies.

Change in the Weather
Posted: June 13th, 2018
by meteorologist Jim Woodmencey
Looks like we will be saying goodbye to the totally sunny days we have had lately. After a week or more of nearly perfect weather to begin the month of June 2018, we can expect some changes at the end of this week and through the Father’s Day Weekend.
Here is Wednesday morning’s weather map:
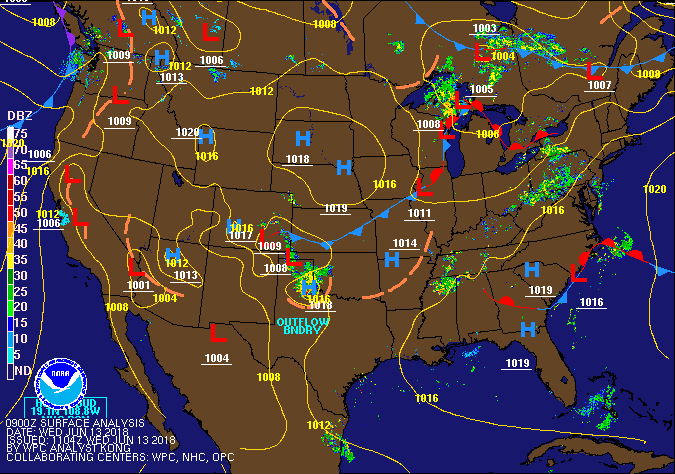
The big blue “H” (High pressure) that has been parked over the Western U.S. & Rockies and kept the atmosphere dry and stable, is beginning to break down. That will be replaced by a Low-pressure system that will move inland the next few days & hang out over the Great Basin into early next week.
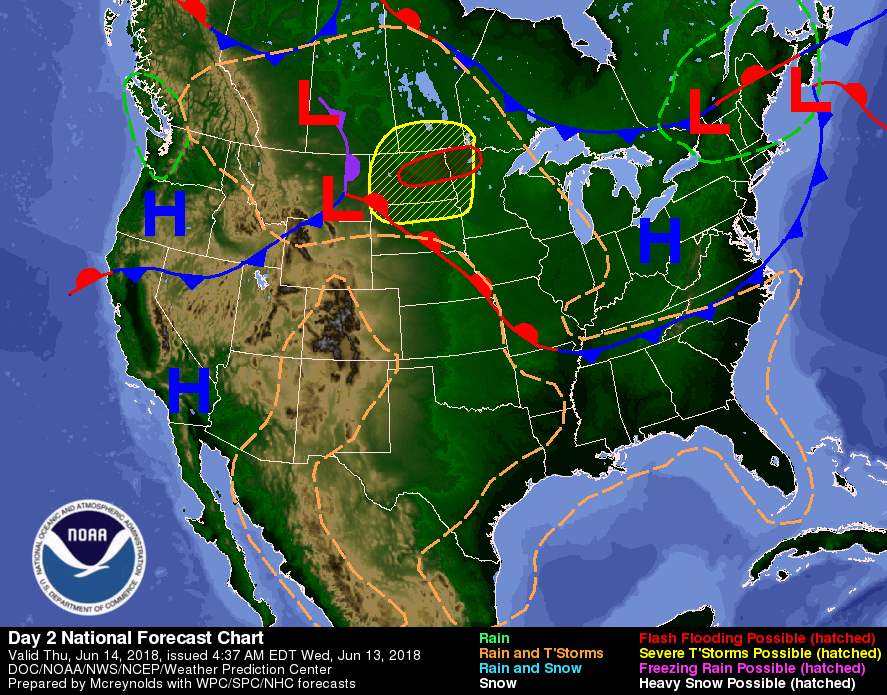
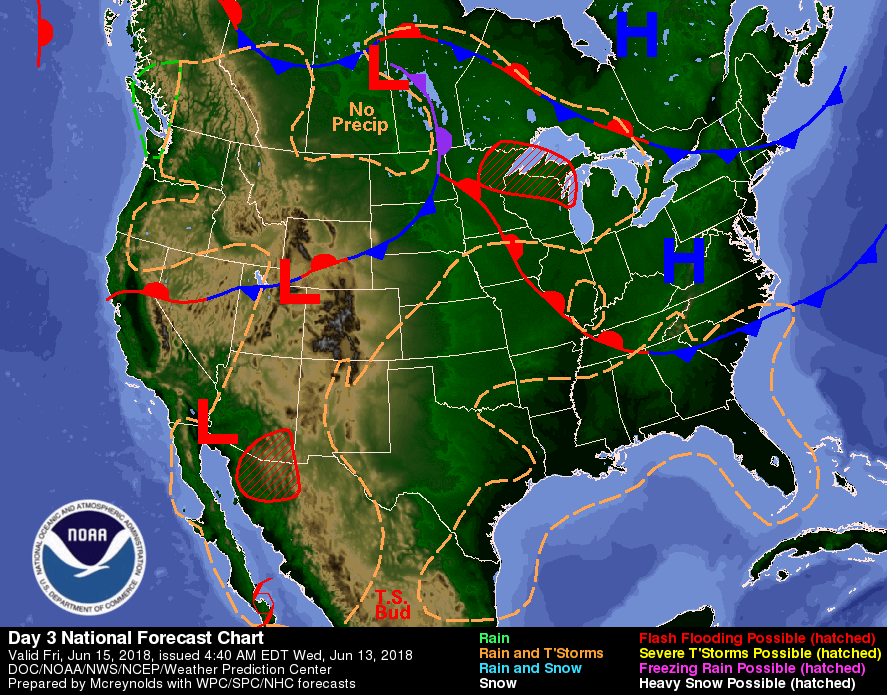
That will lead to some showers & thunderstorms around many areas of the West, including Western Wyoming and the Jackson Hole area beginning as early as Thursday afternoon/evening and then each day thru Sunday, Father’s Day.
Here are the general Forecast Maps for the USA for Thursday & Friday:
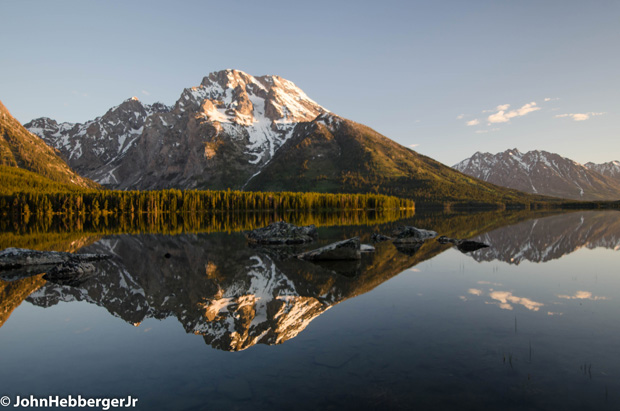
Leigh Lake at Sunrise
New JH Forecast Format
Posted: June 5th, 2018
by meteorologist Jim Woodmencey
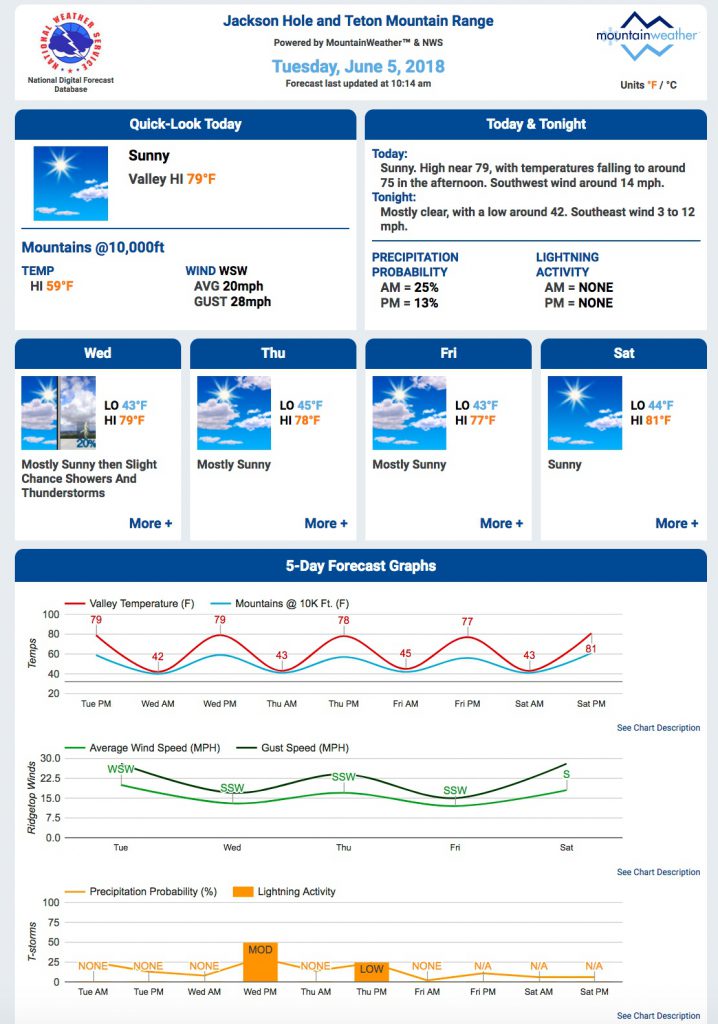
As some of you may have noticed, I have changed my forecast format on the JH Forecast page. After 25-years of doing my own forecast from scratch, starting at 4:00 a.m. each weekday morning, I have decided to take some of the pressure off, so to speak. Not to mention, the huge amount of time it takes, as well as, the stress and frustration that comes with forecasting the weather.
What you see now on the JH Forecast page, is similar to what I have used on this page on weekends & during vacation periods. However, the data in this version is more refined.
What’s New?
The Forecast info you see initiates from computer models, using the National Digital Forecast Database or NDFD, from the National Weather Service. The NDFD contains a blend of several different models. Versus most other weather forecasts that use only a single model for their forecast display, like the weather app that comes with your smartphone, for instance.
This new forecast format from MountainWeather™ uses the NDFD as a base, to start with. I have hand-picked very specific data for the valley and the Teton mountains and then manipulated some of that data. I have made some adjustments to that data to account for deficiencies that I have identified over the last several years of tracking the performance of NDFD data locally.
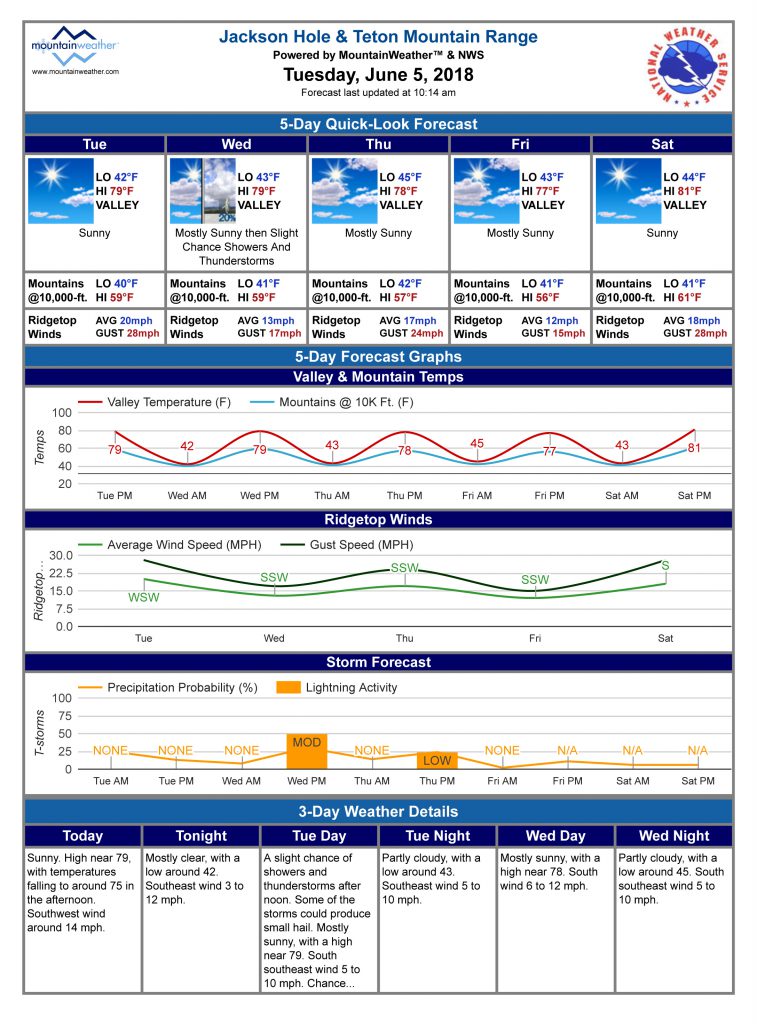
I feel this current format is much better than what was being fed to the site before, on my days off. One major improvement for the summer months, is that the forecast now contains a graph of Thunderstorm/Lightning forecast info (similar to what I had in my own forecast). This was not available in the old NWS version used before.
Here is a sample of the new printable version, which puts all the info on to one readable sheet……(available by clicking a button at the bottom of the forecast).
What’s Good?
Advantages of this new format to you are:
1) Forecast is available in the same format every day of the week. No switching back and forth on weekends, holidays, vacation times, or when I am out of town teaching.
2) Forecast automatically updates itself throughout the day and night, as new computer model data arrives. (The old format, mine and NWS, was only updated once a day, at 7:00 a.m.)
3) Forecasts will now be more consistent, 365 days a year.
(I didn’t say they’d be more accurate!)
Some days the forecast will be right, some days it will be wrong. That would true, no matter who is doing the forecast. Something I have learned over the last 25-years!
Have no fear, I will still be keeping my hand in what data is being fed into this forecast and making improvements and adjustments as necessary.
And as far as I know, the JH Forecast on mountainweather.com is still the only place to get a weather forecast for both the Jackson Hole Valley and the Teton Mountains at 10,000-feet, all on one page!
Thanks for being fans of the weather for so many years and I hope you’ll continue to utilize MountainWeather as your source for Jackson Hole’s weather, and beyond.
Better Weather Heading into June
It looks like the Month of May will finish out with showers, thru Friday June 1st. Then, a Ridge of High pressure builds over the Rockies for dry weather and warmer temps this weekend. That Ridge looks like it sticks around into the middle of next week, with high temps in Jackson reaching back up into the 70’s.
Mountain temps around 10K ft. stay above freezing around the clock this weekend & into early next week, with highs in the 50’s at that elevation.
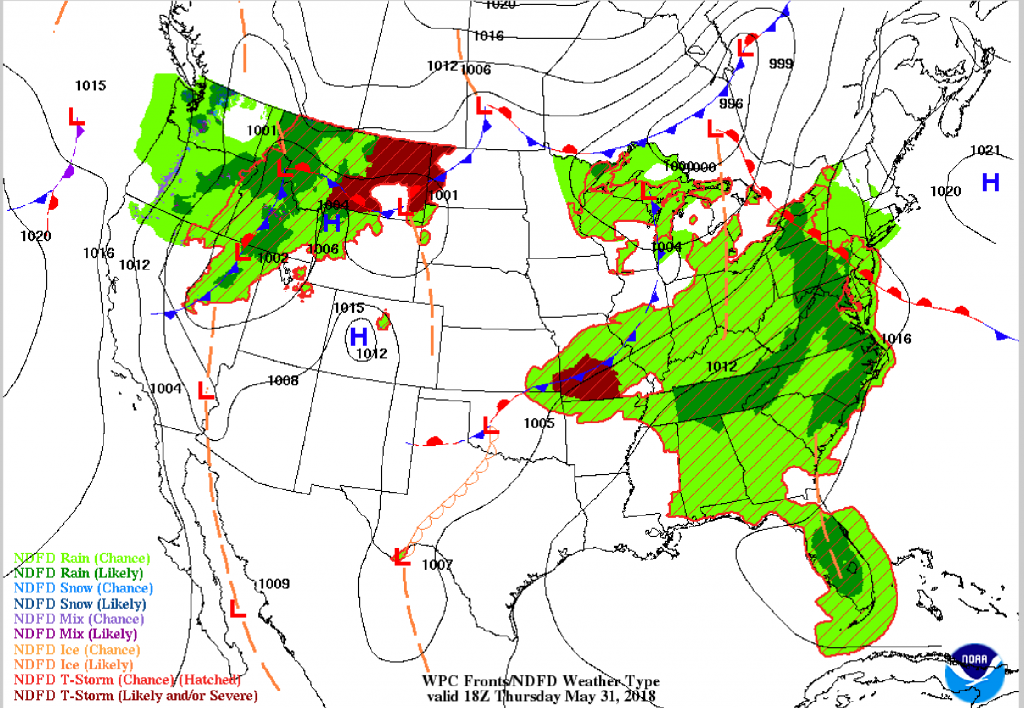
Map below shows precip exiting the Northern Rockies to begin the weekend. And High pressure building over the Northwest U.S. with no precip expected anywhere nearby.
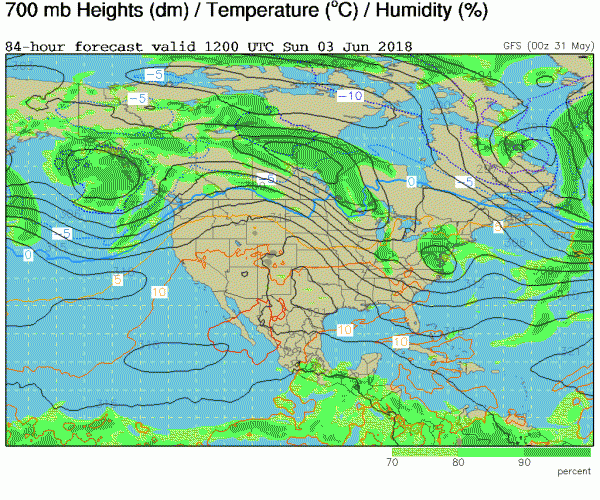
Map below is for 700mb level (@ 10,000-ft.) for Sunday morning, with Ridge intact and no moisture to be found at that level across the whole Western U.S.
Nice! So get outside & have a great weekend!
May Showers
Memorial Day Weather
Posted: Monday May 28th, 2018
by meteorologist Jim Woodmencey
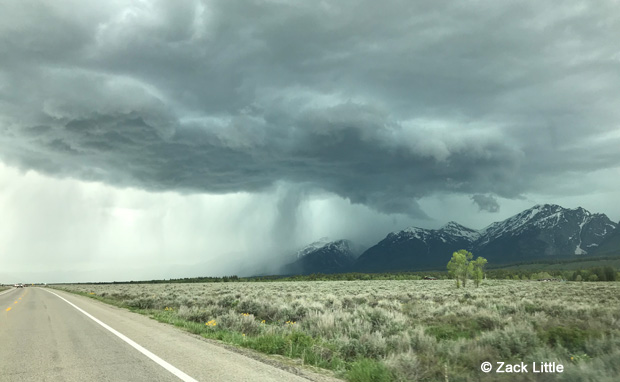
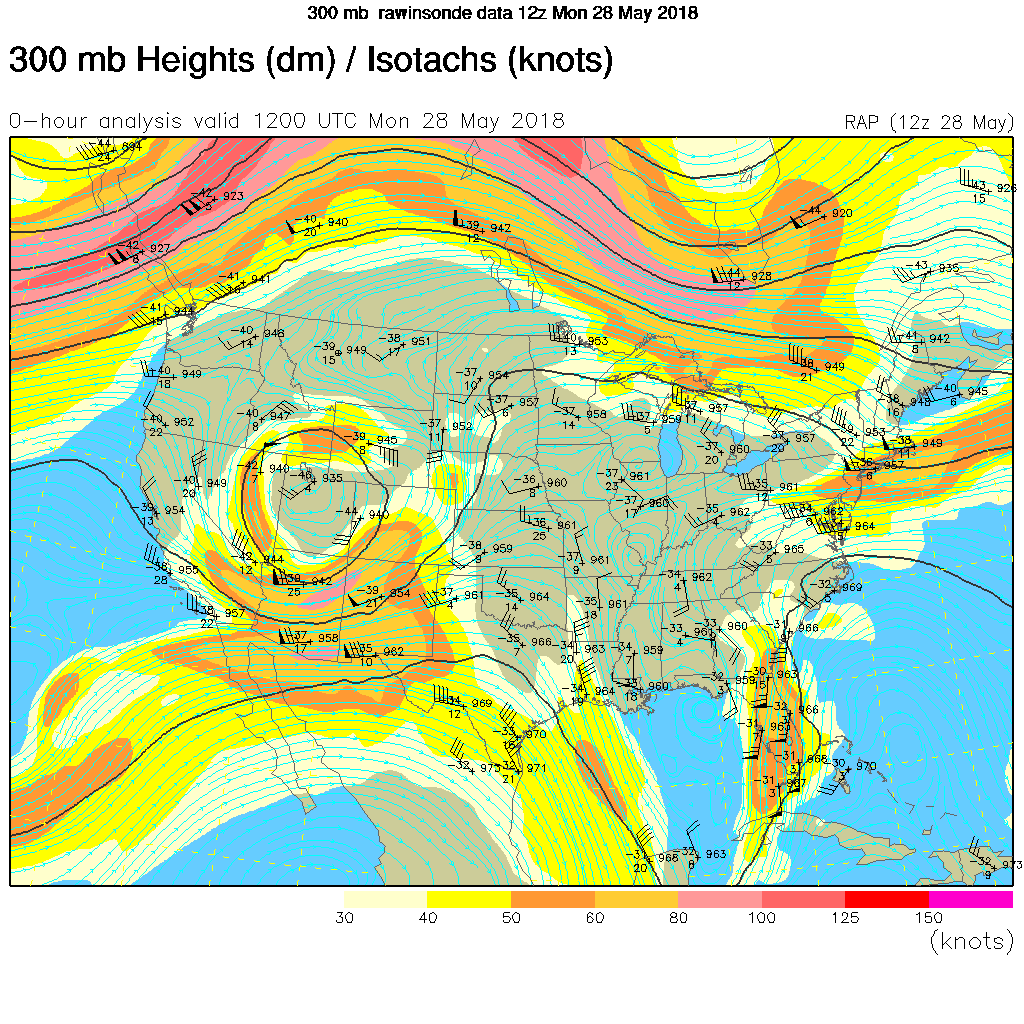
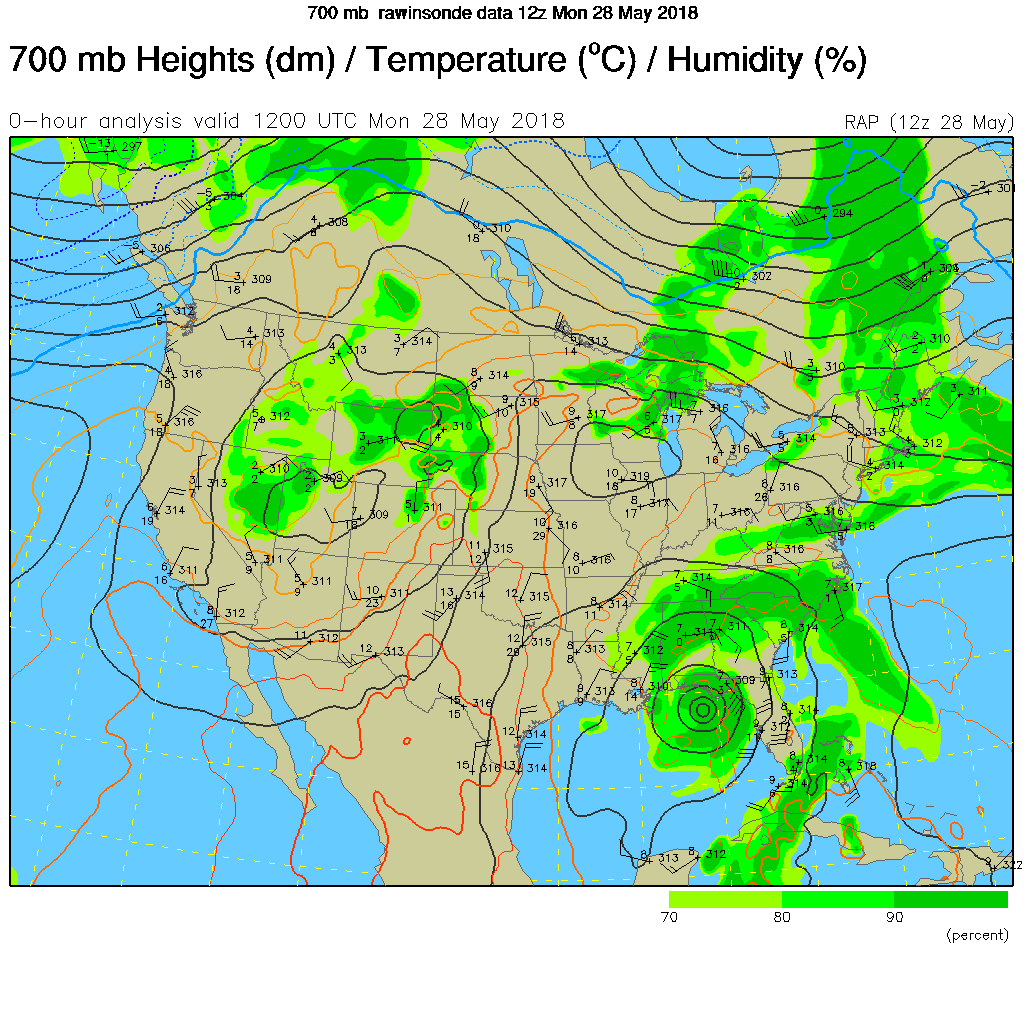
Low-Pressure over Utah is still in place this morning and is circulating moisture & unstable air around the periphery of this Low. Low is present at the surface, shown as the red “L” on Sat photo, and the big round “ball” (a closed Low) on the upper level maps. See the 300mb (@30,000-ft.) jet stream map and 700 mb (@10,000-ft.).
Moisture will still be streaming over northern Wyoming today, Memorial Day, and circulating around that Low-pressure (counter-clockwise rotation) from East to West. Causing more rain & thunderstorms.
Weather will gradually improve through mid-week as this Low moves east into the Plains States.

Memorial Day Weekend Outlook
Posted: Thursday, May 24th, 2018
by meteorologist Jim Woodmencey
After some rainy weather Wednesday, due to a moist and unstable airmass over the western Wyoming, we will finally see some drying the next couple of days. However, do expect some shower activity to return over the Memorial Day Weekend. Best chances for some showers & afternoon thundershowers will be over the mountains, late Saturday thru Monday afternoon.
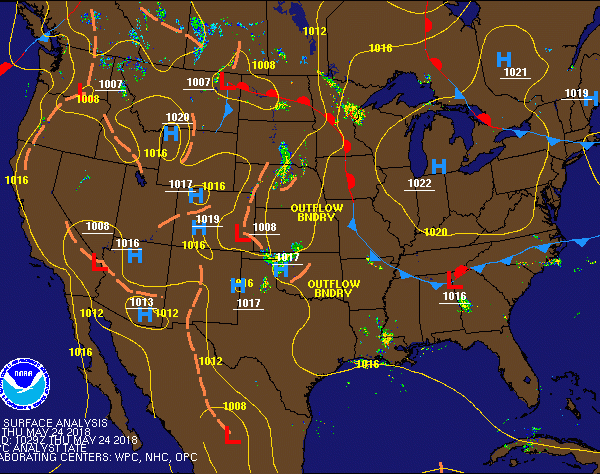
Why?….Because weak Low-pressure over the Northwestern U.S. will be replaced by weak High pressure on Friday, that sticks around only briefly, bringing the nicest weather. Then an upper level Low-pressure center off the West Coast will move inland and sit over Nevada & Utah later Saturday into Monday, Memorial Day.
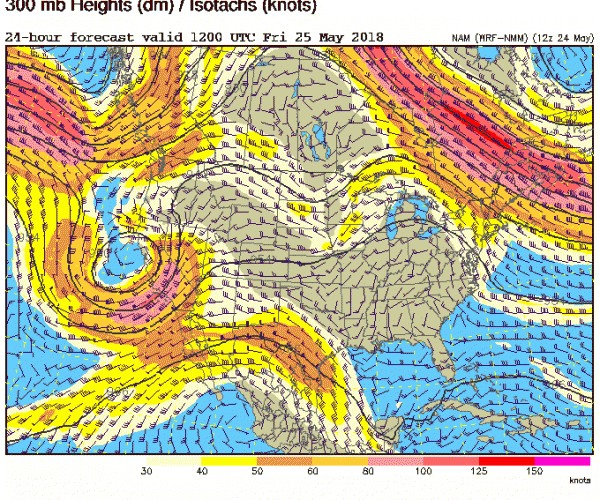
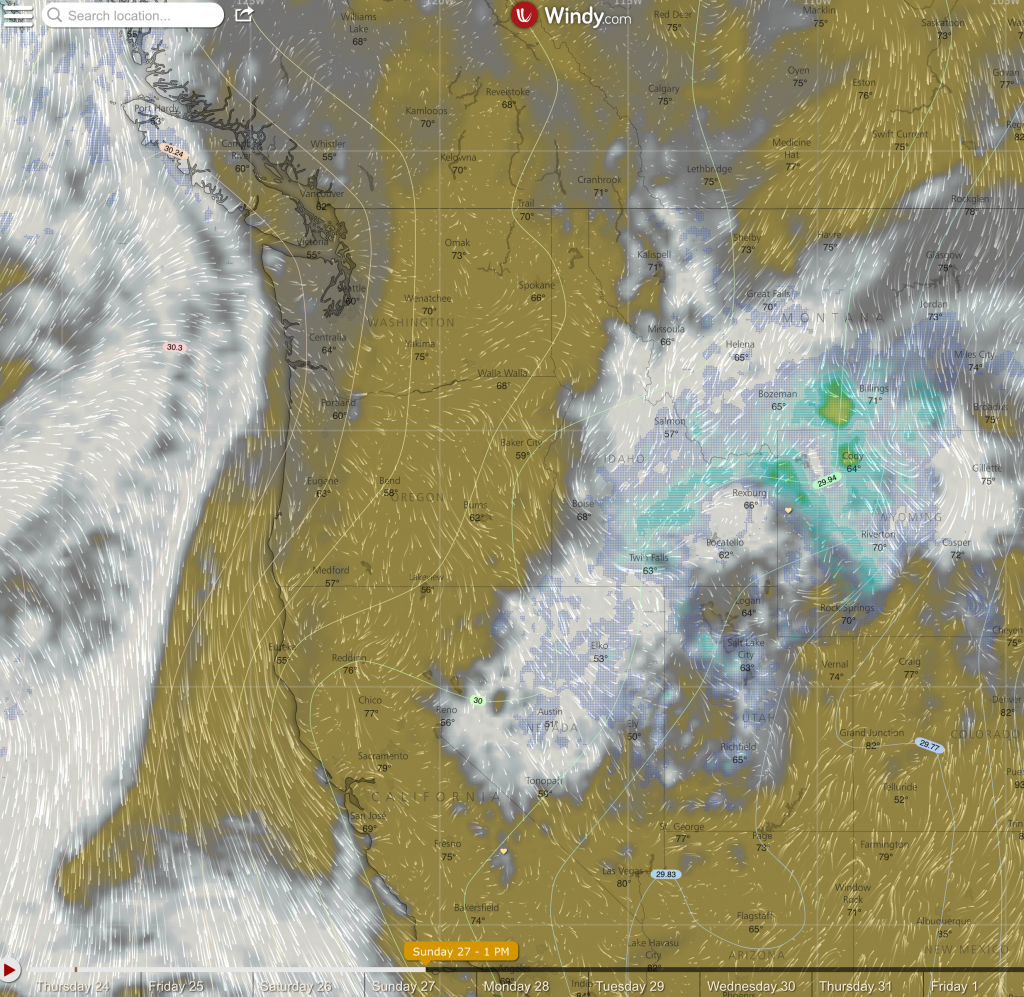
Not a ton of moisture evident directly over JH with that approaching Low , but enough to generate some showers, and some chance of scattered thunderstorms, especially afternoon and evening hours as temps will be warmer, 70’s in Jackson Friday & Saturday. Upper 60’s Sunday & Monday with more cloud cover.
Click on the map below to view a cloud & precipitation forecast from the Euro-model, (courtesy of Windy.com). Check it out. Gray is percent cloud cover, the greens/blues are precipitation.
Links to more forecast maps & models can be found on these two pages:
USA Forecast Maps
Kodachrome Basin