All posts by Jim Woodmencey
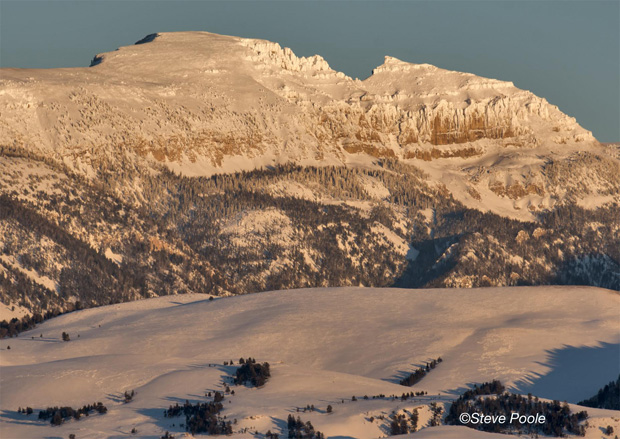
A Good Old-Fashioned December in Jackson Hole
Normally at end of the year, I like to review the weather highlights for the past 12 months. However, this December had so much weather to talk about, that I could easily fill this space with the highlights from this past month alone. Which is what I will do. Two weeks from now, in the next Mountain Weather column, I will give you the full review of the weather in Jackson Hole in 2016, with all of its high and low points.
Abundant Snowfall
The buzz about town, and at the ski areas, was how HUGE December was for snow. And it was big, by several different measures.
First, the Town of Jackson had above normal snowfall, with 23 inches recorded, compared to the average in town in December of 17 inches. That number for this December is a little low, because there was a day or two of missed readings due to the Holidays. In reality, town received more than 23 inches in December.
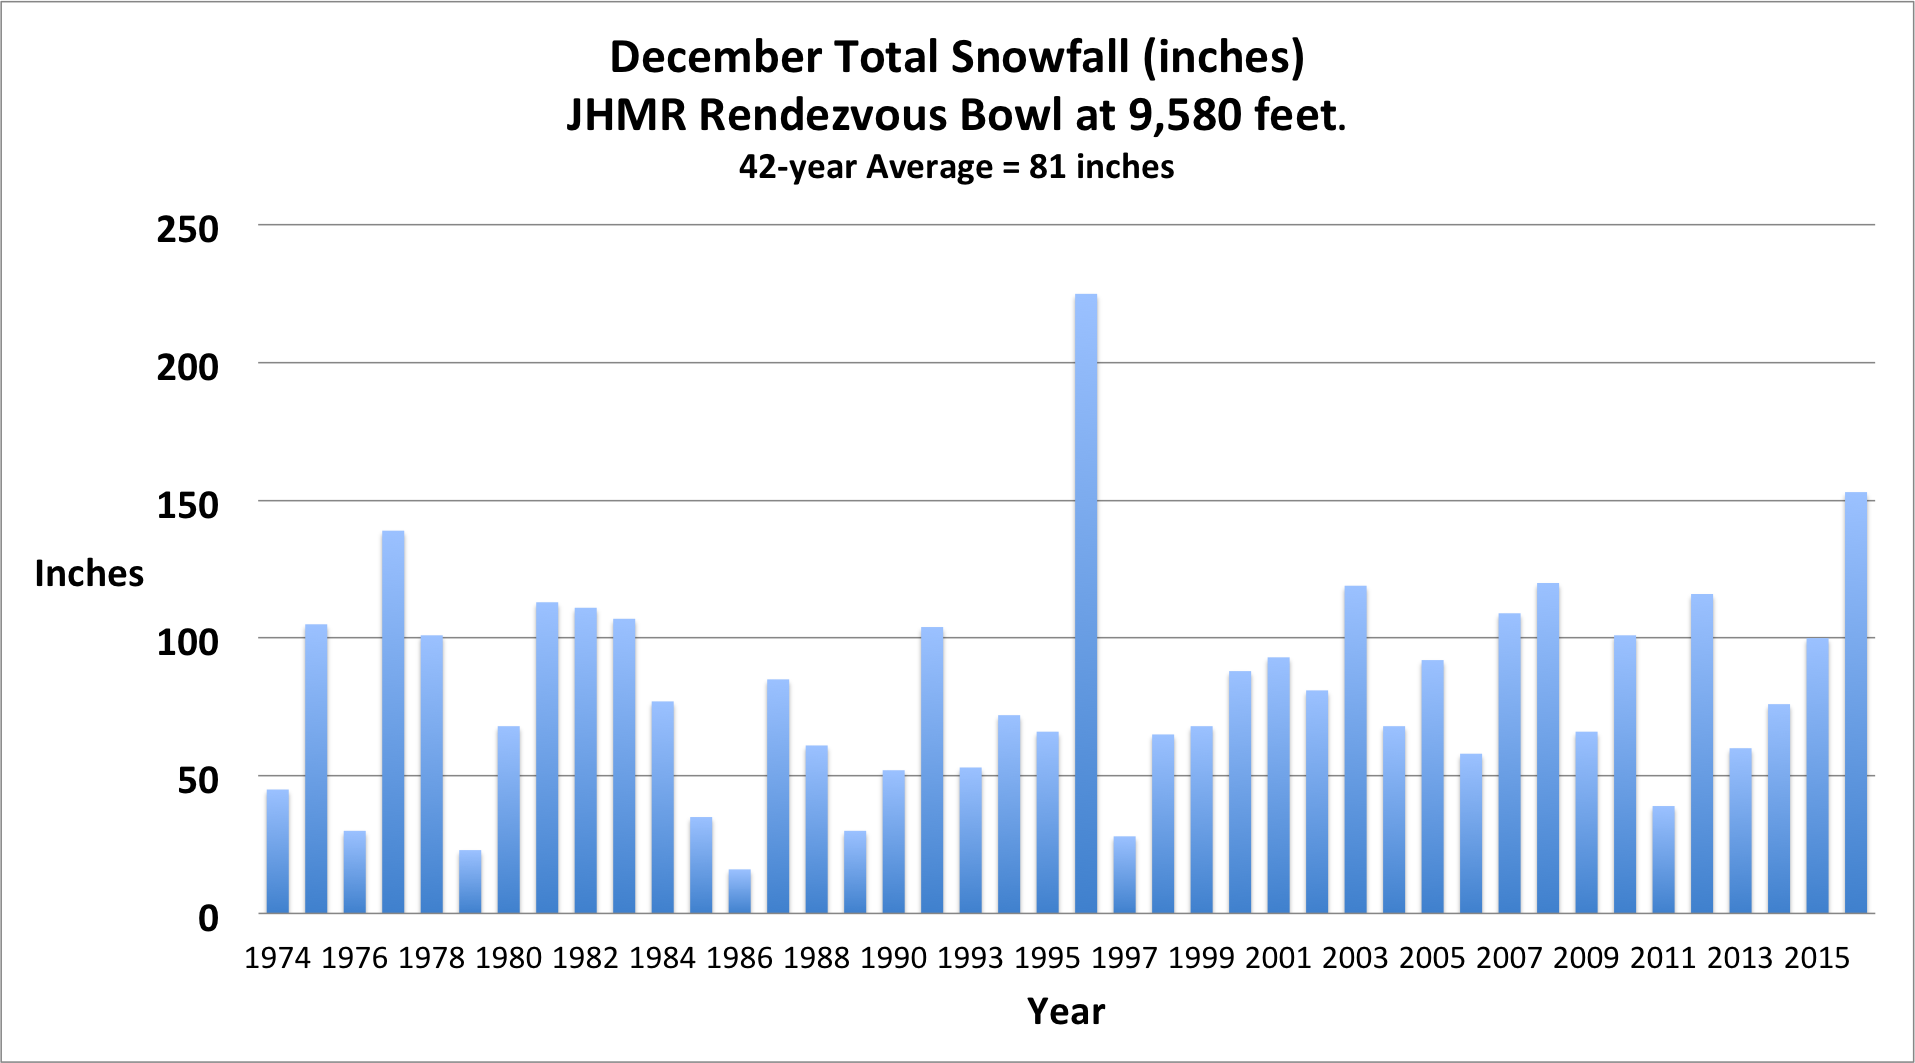
The Jackson Hole Mountain Resort’s Rendezvous Bowl weather station recorded 153 inches of snowfall in December, at the 9,580-ft. elevation. That makes December 2016 the second snowiest December in their recorded history. December 1996 is still the December to beat; it had 225 inches of snowfall, which was the largest monthly snowfall on the mountain, ever. By the way, the average in December at this site is 81 inches.
Mid-mountain, at the 8,180-ft. elevation, had its third snowiest December with 128 inches. December of 1996 and 1977, were number one and two, respectively. Even at the base of the mountain (6,510-ft.) December’s snowfall of 58 inches was 20-inches above the December average of 38 inches.
Also notable: On the last day of December, the settled snowdepth at Rendezvous Bowl was at 90 inches. That is the second deepest December 31st snowdepth ever, behind that big December of 1996, which had 114 inches on December 31st. The 40-year average snowdepth in Rendezvous Bowl on December 31st is 57 inches.
December 2016 and December 1996 were head-and-shoulders above normal for snow at the Jackson Hole Mountain Resort. Question is, will we have to wait another 20 years to see another December like this?
Temperature Swings
The other weather factor that left its signature this December was the temperatures. Wild swings from warm to cold are common, maybe once in a month, but not once a week! We experienced temperature changes in the valley of 40-degrees or more within a couple of days, on multiple occasions.
For example: On December 4th, the high temperature in town was 31-degrees and the low temperature was 21-degrees. Two days later, on December 6th, the high was only 4-degrees, and the low was 21-degrees below zero. That was a 52-degree swing, between the high temperature and the low temperature, in just two days.
The coldest temperature we had in December 2016 was 24-below zero on the morning of December 8th. By the next day the afternoon high temperature was 35-degrees. The day after that, the high was 37 degrees, making for a 61-degree rise in temperature within two days.
The warmest temperature of the month occurred on December 15th when the high reached 39-degrees. The morning low on December 16th was only 35 degrees. Then the very next day, the morning low was 15-degrees below zero, and the high that day was only 8-degrees.
In the end, it was an exceptionally cold December; with average high temperatures almost five degrees colder than normal and average low temperatures for the month were seven degrees colder than the long-term average.
What caused it all?
Most will say that it was La Nina that caused this cold & snowy December. That may have had something to do with it, and that is certainly the preferred short answer.
The longer, more technical answer is, that a zonal or westerly jet stream flow persisted across the Pacific and extended all the way across the Western United States for a good portion of the month.
That jet stream carried copious amounts of moisture inland from the Pacific, and when the jet was south of us, we were colder, and when it shifted north of us it got warm, with rain in the valley.
That jet stream is not continuous anymore, and a complex blocking pattern in the Pacific has slowed the flow and caused a split in the jet stream for the start of the New Year. It’s still a La Nina, that didn’t go anywhere, but the westerly flow and the big snow are on hold until the pattern changes again.
Jim is the chief meteorologist at mountainweather.com and has been forecasting the weather in Jackson Hole and the Teton Mountains for the last 25 years.
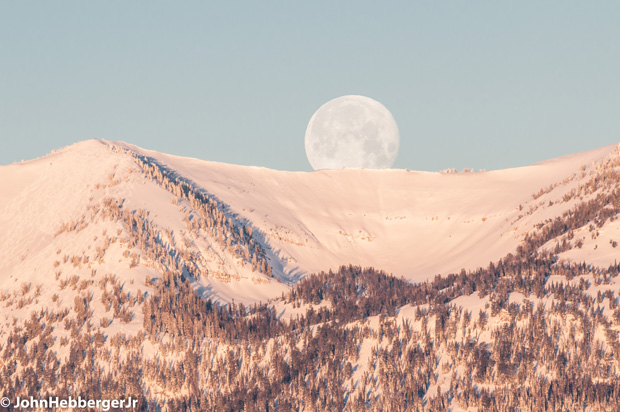
Full Moon over Mt. Glory
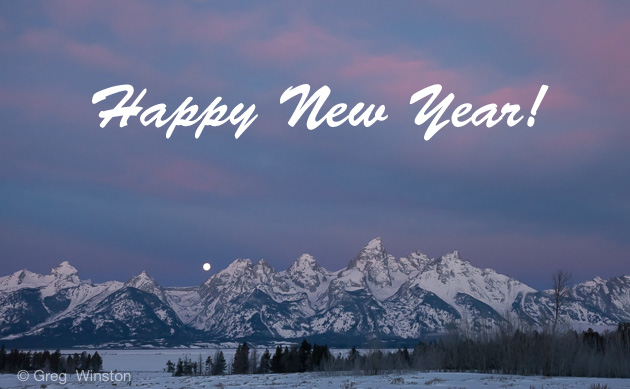
Happy New Year 2017
JHMR Goes Deep, Top to Bottom!
6:00 am MST Wednesday December 28th, 2016:
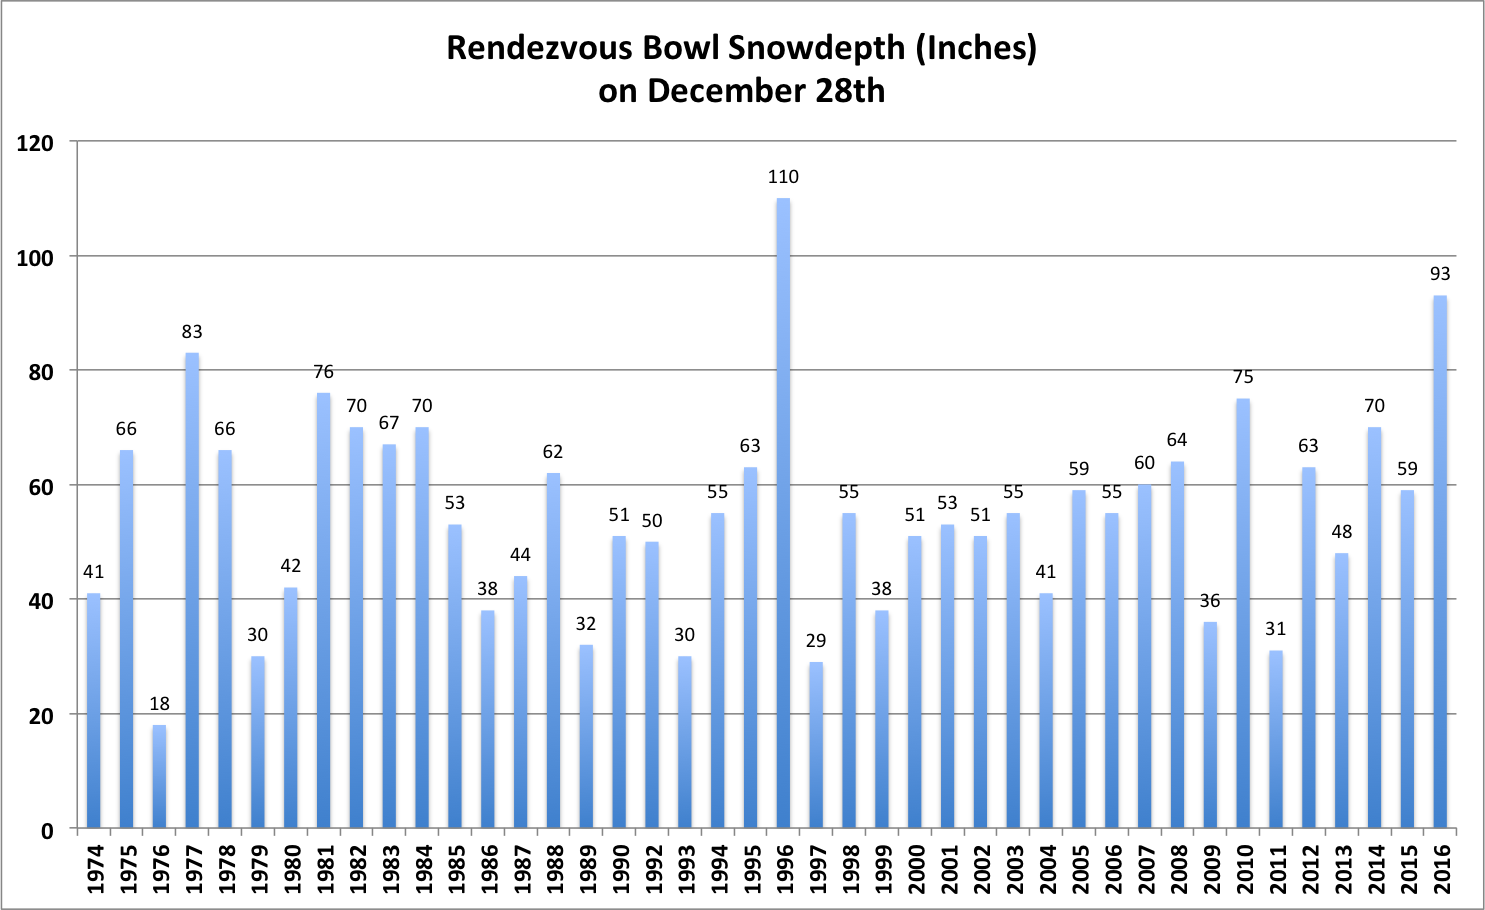
On the Upper Mountain at the Jackson Hole Mountain Resort, the settled snow depth at the bottom of Rendezvous Bowl (Elevation: 9,580-ft.) stood at 93 inches. That is the second deepest snowdepth for this date, in the last 42 years of records for that site.
The only other year that surpassed that depth was 20 years ago, on December 28th, 1996, when the snowpack was 110 inches deep.
The average snowdepth at Rendezvous Bowl on December 28th is 54 inches, which means 2016’s depth is over 3 feet deeper than average (39 inches or 1 meter, to be exact).
Mid-Mountain depths were also above normal, at the 8,180-ft. elevation, the settled snowdepth was 62 inches, or 14 inches deeper than the average of 48 inches.
The Base of the mountain, elevation= 6, 510-ft., the snowdepth was at 33 inches, which is a foot deeper than the average of 21 inches.
Summary compiled by mountainweather.com meteorologist Jim Woodmencey
Sleigh Ride and the Tetons
Merry Christmas
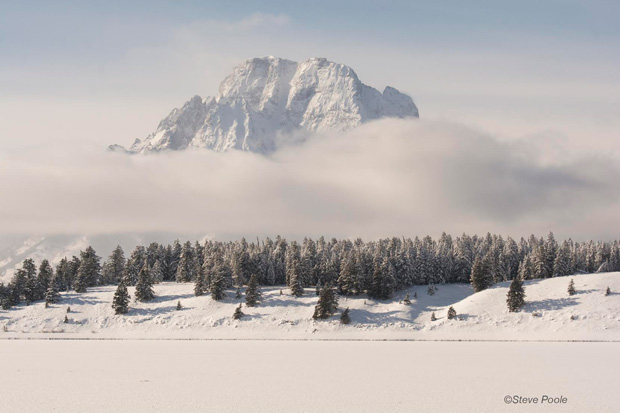
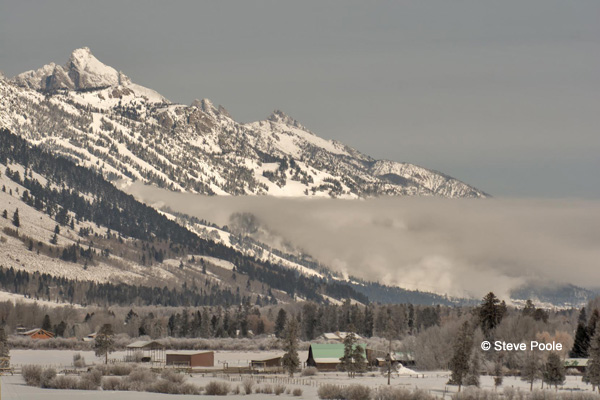
Frosted Mt. Moran
Snow Making Cloud
La Nina is here. So what does that mean?
(This article first appeared in the Jackson Hole News & Guide, Nov. 23rd, 2016 issue.)
About a week or so ago, NOAA’s Climate Prediction Center announced that, “La Nina conditions were present and favored to persist through the winter 2016-17”. This caused local skiers and boarders to rejoice with primal screams of joy and dreams of a HUGE powder season. Why? Because they have been told over the years that: La Nina is good for snow and El Nino is not.
I hate to be the one to scrape the wax off your boards, but you need to slow down a minute and understand what exactly La Nina is, and what it MIGHT mean for snowfall around Jackson Hole in the winter. That is what I will attempt to bring to this week’s column
What is it?
La Nina & El Nino are conditions that occur in the Equatorial Pacific when there is a departure from “normal” Sea Surface Temperatures. We call it an El Nino when these temperatures are warmer than normal, and La Nina they are cooler than normal.
During an El Nino, there is a weakening pressure gradient between the eastern Pacific & western Pacific, and weaker easterly trade winds develop, allowing warmer surface water to surge eastward, replacing normal cooler water off the coast of South America. This leaves a belt of warm water along the Equator in the Pacific.
La Nina conditions occur when those easterly trade winds are stronger, causing cooler water in the eastern Pacific, near the coast of South America, to spread westward. That leaves a belt of cool water along the Equator.
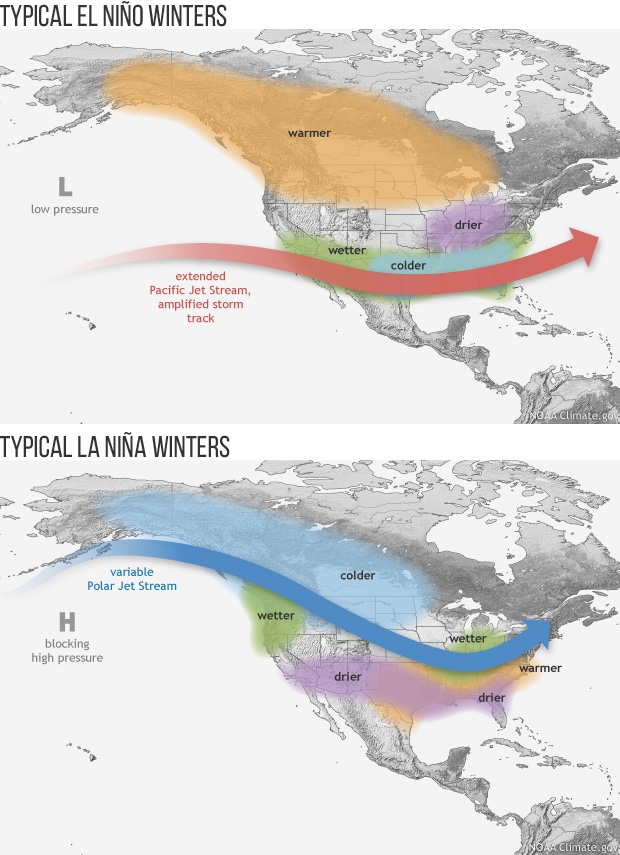
How much warmer or cooler those water temperatures are, determines how strong or weak the El Nino or La Nina is. Since temperature and pressure are directly related, El Nino or La Nina will have an affect on the pressure patterns (weather patterns) and the jet stream (storm track) across the northern Pacific Ocean during the winter months.
Typically, during El Nino winters, the Southwestern U.S is cooler and snowier, while the Northwestern U.S. is warmer with less snowfall.
Typically, during La Nina winters, the Northwestern U.S. is cooler with above normal snowfall, while the Southwestern U.S is warm and dry.
How Big is it?
Calling for a “La Nina Winter” is not a slam-dunk that we will have above average snowfall. At this point, we have what is considered a weak La Nina, and the Climate Prediction Center is only giving it a 55-percent probability of persisting during the December, January and February time-frame. That probability drops to a 43-percent for the 3-month period, January though March.
During our most recent strong La Nina winters (2010-11 and 2007-08), we had way above normal snowfall. These were banner winters for powder. However, during the latest two weaker La Nina’s (2000-01 and 2011-12) Jackson Hole experienced below normal snowfall.
The same comparisons could be made for El Nino Winters. Remember last year? The Super El Nino, the Godzilla of all El Ninos, it was called. We were supposed to be drier than normal. We were not, snowfall in town was right at average, and the mountains were just above average.
The weather is never as cut-and-dried or as simple as you might believe. It’s complicated, has lots of moving parts, and La Nina is just one of those parts. A small shift in the weather pattern out in the Pacific, at any given time during the winter, can have a major effect on where storms track across the Western United States. Thus, the variability we see from one El Nino or La Nina year, to another.
I like to say, “The reality of the weather is not always as described in the forecast”.
All that said, I will still guarantee you, that every time we get a good snowstorm this winter, people will say, “How about that La Nina, pretty good, huh?” And, every time we go through a week without any snow, they will ask, “What happened to that La Nina? Where did it go?”
Jim is the chief meteorologist at mountainweather.com and has been forecasting the weather in Jackson Hole and the Teton Mountains for 25 years.