|
| Meteorologist Jim Woodmencey |
(Note: Content in this post first appeared in the MountainWeather column in the Jackson Hole News & Guide June 8, 2016)
Sometimes, the forecast can be confusing or misleading, especially when it comes to understanding the “probability of precipitation. In this week’s column I will explain what those percentages really mean, by way of analogy.
Weather Doctor
Being a meteorologist is a lot like being a doctor, except that my patient is the atmosphere. That patient shows up in my office everyday with a different set of symptoms and ailments. My task is to analyze what is wrong with my patient.
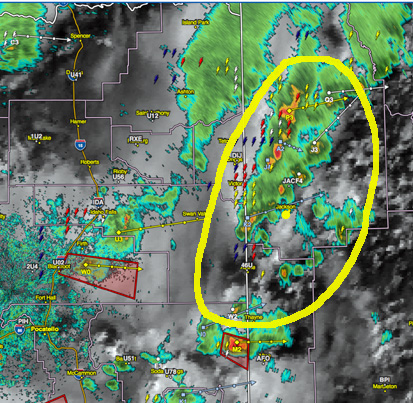
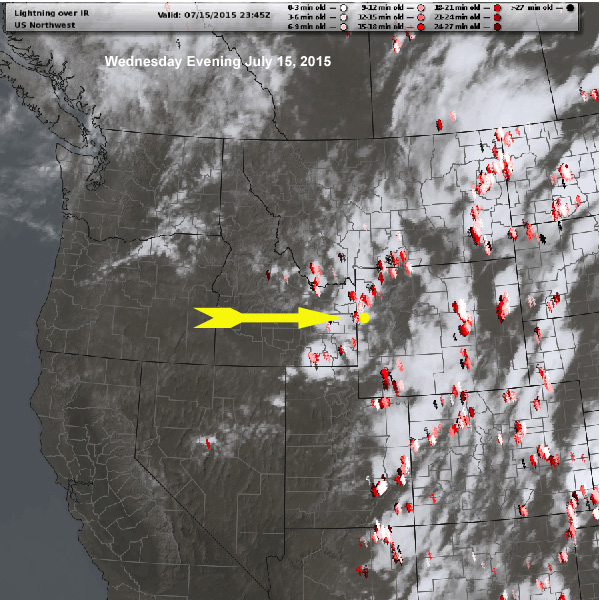
I begin my assessment by looking at satellite and radar images, along with a host of weather maps and observations to get some baseline information. Kind of like the nurse taking your vitals and patient history.
Next, I try and diagnose the problem (or problems) the atmosphere might be presenting to me. I look for the obvious signs and symptoms first. Some days they may be so obvious that the diagnosis is relatively simple. For instance, if it is already pouring rain and thunder-storming outside, then the forecast will be easy, “rain and thunderstorms today”.
That would be kind of like a real patient walking into the doctor’s office with an open fracture of the lower leg. The diagnosis is easy, “your leg is broken”.
Most days though, my patient’s condition requires further diagnosis and testing, as I’m sure it is with many doctor’s patients. Whenever the complaints and symptoms are quite subtle or perhaps very complicated, then an accurate diagnosis becomes more difficult. The same is true with the weather.
Initially, I might say, “I think it might rain today”. The doctor might say, “I think you might have a tumor”.
That’s when the doctor sends you for the blood tests, the x-rays, the MRI’s, the colonoscopies (ugh!), or whatever other tests are necessary to help make a better diagnosis of your problem and how to treat it. That is when I head to the computer models, to help guide me towards making a decision about what the weather is going to do.
Sometimes, the final prognosis, meteorologically or medically, is more of a guess. An educated guess, based on your training, experience and how often you have seen these same conditions.
Probability
The doctor might tell me that after surgery, that I might have a 50/50 chance of surviving. Like the doctor’s prognosis, weather forecasts are also an expression of uncertainty. Probability of precipitation may be the most looked-at part of any weather forecast, but I imagine it is also the least understood.
Probability in a forecast is usually expressed in percent, 30-percent chance of showers, a 60-percent chance of thunderstorms, etc. etc. But what does that really mean?
Probability of precipitation is an expression of two factors: Confidence and Area.
How confident is the forecaster, or the computer model, that precipitation could actually occur, and over how much of the forecast area will it occur, if it does.
Case1: The forecaster is very confident, 100-percent, that measurable precipitation will occur, but it may not occur everywhere within the forecast area, such as Teton County, as an example. That might generate a 50% probability of precipitation (PoP).
Case 2: The forecaster’s confidence that measurable rain will occur is not that high, say 50-percent confidence, but if it does rain, it would rain over the entire forecast area. That would also generate a 50-percent PoP.
The problem is, you don’t know which case was used for the forecast. Which doesn’t really make this any less confusing or misleading, does it?
Given that, I would say that the best way to interpret these examples is to say: “There is a 50-percent chance that precipitation could occur at any point within the forecast area, during the forecast time period”.
A “50-percent chance of rain” does not mean that it will rain over half of the time period, or over half the forecast area. Which is a common misinterpretation of PoP.
The table compares the percentages to the uncertain terms and the alternate descriptors used in most forecasts, to give you a reference to work from when making decisions about what that forecast really means.
Remember, the forecast is just guidance, like your doctors advice. In some cases, it may or may not rain, and you may or may not die.
Note: My apologies to any doctors reading this, I did not mean to imply that weather forecasting was as easy as brain surgery.
|
Probability of Precipitation
|
|
Probability
|
“Uncertain” Term
|
Alternate Description
|
|
10 to 20 %
|
Slight Chance
|
Isolated
|
|
30 % to 50 %
|
Chance
|
Scattered
|
|
60 % to 70 %
|
Likely or Possible
|
Widespread or Numerous
|
|
80 % to 100 %
|
No terms used, forecast just reads: “Rain”, “Snow”, “Thunderstorms”, etc.
|
Jim is the chief meteorologist at mountainweather.com and has been forecasting the weather in Jackson Hole and the Teton Mountains for nearly 25 years.