 |
| Meteorologist Jim Woodmencey |
(Article re-printed from the Mountain Weather Column in the Jackson Hole News and Guide, May 14, 2014)
Spring is the time of year that we can experience an increase in the wind around western Wyoming, even here in the relatively wind-protected Jackson Hole Valley. Usually when the wind picks up around here, I am asked one of two questions, either, “When is it going to stop?” or “Why is it so windy?”
Answering the first question correctly depends on how good a forecast I did that day. Answering the second question usually requires a lengthier and more technical explanation.
In this week’s column, I will give you that more technical explanation, to save us both some time when I see you on the street on the next “windy” day.
The Wind Blows
Bob Dylan says, “You don’t need to be a weatherman to know which way the wind blows”. I say to Bob, “But, it doesn’t hurt!”
Wind is a rather elusive meteorological variable, especially since we can’t really see it, like we can clouds or precipitation. Wind, during a storm, is something we expect. Wind can be an unpleasant nuisance though, especially on a bluebird day, to cyclists, sailors, paragliders, climbers, etc.
The atmosphere is constantly adjusting itself, trying to balance the changes in temperature and humidity from one part of the planet to the other. This leads to different areas of high and low pressure that encircle the globe, and the bigger the difference in temperature, and/or humidity, from one area to another, the bigger the difference in pressure, and the faster the wind blows.
That’s what gets it started in motion, always moving from high pressure towards lower pressure. Friction at the surface, mountains, buildings, etc. can slow the wind down and alter its direction. In the upper levels of the atmosphere, the wind starts moving from high to low, but it gets re-routed, and turned to the right in the northern hemisphere, because the earth is rotating. This is known as the Coriolis Effect.
When we observe stronger winds, it means that there is a big difference in pressure across the region, or sometimes across the entire country. A big low-pressure center over the mid-western U.S. and a big area of high-pressure along the West Coast, for instance, could result in strong winds in-between, over the Rockies.
That difference in pressure from Point-A to Point-B is known as a pressure-gradient. A strong pressure-gradient equals strong winds. You can track that each day by looking at a surface weather map, and look for big highs and big lows, and lots of pressure contour lines in-between, as well.
The other thing that can cause strong winds at the surface is when the jet stream is directly overhead.
The Jet Stream
The jet stream lives up at around 30,000-ft. in the atmosphere, up where jets fly. It is defined as the region of the atmosphere where the fastest winds are occurring. The jet stream is also a dividing line, of sorts, between the coldest air to the north, and warmest air to the south. And once again, wherever there is a big difference in temperature across a region of the world, there will be a big difference in pressure, and thus faster wind speeds.
In the springtime, the jet stream is trying to migrate from a more southern position to a more northern position, following the line between the warmest and coldest air, which is changing rapidly with the tilt of the earth, the angle of the sun, and increased solar radiation over the northern Hemisphere.
Whenever that jet is directly overhead, it has the potential to translate down to the surface and give us a little more wind down here at the surface.
You can track when the winds will be decreasing by following the progression of the jet stream, and when it is moving away from your location.
Find current, and forecasted, surface maps and jet stream maps here:
USA Forecast Maps
USA Forecast Maps
Jim is the chief meteorologist at mountainweather.com and has been forecasting the weather in Jackson Hole and the Teton Mountains for over 20 years.
|
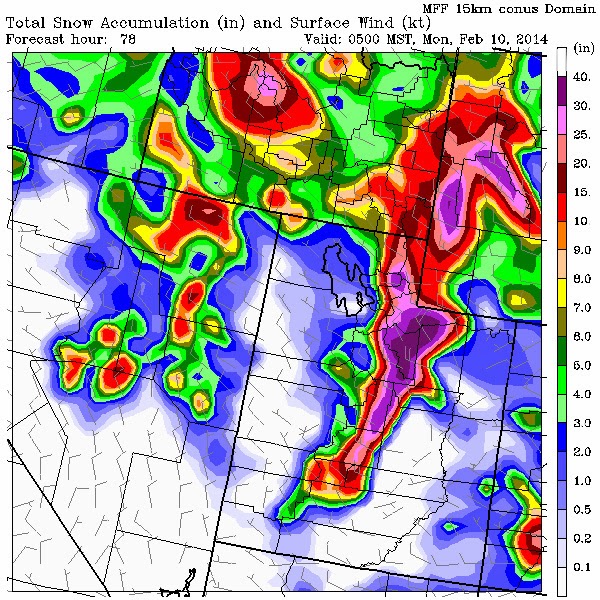
Weather Map Examples of Northerly Wind over Rockies
|
|
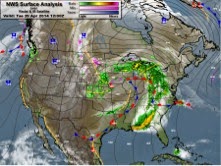 Source: MeteoStar
|
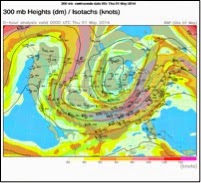 Source: NCAR
|
|
Surface Map
|
Jet Stream Map
|