All posts by Jim Woodmencey

First Blast of Cold Canadian Air

Cold air pushing down through Montana this morning, with snow down along the east side of the Continental Divide down to fairly low elevations, like around Pendroy, MT located northwest of Great Falls and just east of the Rockies ( Web cam pic below).

US Hwy 89 Near Pendroy, MT

And snowing down into Southwest Montana around Bozeman & Livingston. (See pic from cam on Bozeman Pass). And Beartooth Pass closed this morning, due to winter weather!
Snow showers will push down through parts of Yellowstone Park today, along the Continental Divide.
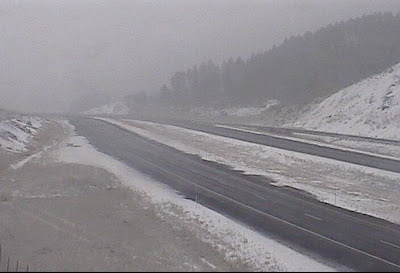
I-90 over Bozeman Pass, MT

In Jackson Hole, we’ll get the cold air, and the wind out ahead of that push of cold air, but snow will stay east of the Divide. Only a small chance of a few flakes over the west side of the divide in Northwest Wyoming today.

Read more about what is causing the weather this week by reading the “Full Weather Discussion & Outlook” at the bottom of the Jackson Hole Forecast Page.

Post by meteorologist Jim Woodmencey
Wednesday, October 3, 2012

Fall Colors on Schedule


This past Saturday, September 22nd, was the Autumnal Equinox and the official end of summer and start of the Fall Season. Almost as if on cue, good fall colors can be seen over the Rocky Mountain West. This last week in September and the first week in October seem to be normal timing for peak fall colors, this year no exception.
One exception I did note while flying back to the Tetons from the East Coast, on the day of the Equinox, a route that took me over the Northern Colorado Rockies (very yellow at high elevations!) and up along the Wasatch and northern Utah mountain ranges,  was how much red there was to the leaves in the mountains of Utah this year. More mountain maples than aspen trees, perhaps?
With the weather the next 7 days or so shaping up to have cooler mornings at all elevations, getting down to freezing or just below, we should see an acceleration in the color change. We will also experience fairly light winds at all elevations thru early next week, which will help to keep the majority of those leaves on the trees.
This is one of my favorite times of the year to get out an hike or ride my bike and soak in the golds & reds, a nice contrast to the greens of summer and white of winter.

Text & photo submitted by meteorologist Jim Woodmencey

Horsethief Fire Weather Page

If you are really into the weather and especially weather related to fire behavior, you can follow along more closely with information posted on the NWS Riverton website page that was set up to assist the fire weather forecasters working the Little Horsethief Wildfire near Jackson,WY.

Main link is here: NWS Horsethief Fire page
I will set up a direct link to this page at the top of the  Jackson Hole Forecast Page and also under the Fire Weather Information section at the bottom of the Jackson Hole Information Page on www.mountainweather.com

Some of the cool stuff of interest might be the Hi-resolution Satellite photos that show the smoke plume best when skies are clear during the day, see below:

Hi-Resolution Visible Satellite Photo of Wyoming

There is much more to view here, some of it is more technical fire weather forecast products & computer models, but other info of general interest is the Loop from the Web Cam on top of Teton Pass that looks towards the fire.

Teton Pass Web Cam Loop

And also the Fire Weather Briefing Page for Teton County Emergency Managers
(click the bold print).

Posted by meteorologist Jim Woodmencey
9-12-2012

Fire Weather & Air Quality

Photos below show the quick progression of the Horsethief / Wilson Canyon Fire as it blew up on Sunday afternoon, between 2:00 pm & 3:15 pm. Most of these photos were taken from the ridge on Munger Mountain, along the Wally’s World Trail. Munger Mountain is located to the Southwest of the fire. 
This series of photos shows how quickly a fire can blow up during the afternoon heating, even in September. Time between the first and last photo from Munger was a little over 1 hour and 15 minutes. 
Final photo was smoke plume viewed from the Rodeo grounds in Jackson, looking at north side of Snow King, around 5:00 pm.
Horsethief Fire September 9, 2012
 First shot from Munger @ 2:00 pm
Last shot from Munger @ 3:15 pm
 Taken from Rodeo Grounds in Jackson @ 5:00 pm

Where to Find Fire & Air Quality Info

I have had many requests for good sources of both fire information and air quality information, therefore, you can now find many links to both on www.mountainweather.com under the Jackson Hole drop down on the menu bar, by clicking to the Jackson Hole Information Page……some National fire info & air quality info is also available here.
Unfortunately, getting real-time and real specific info on fires and air quality is not like getting satellite photos & radar images that are updating automatically, all the time. So, my advice be patient and take some time to click around to gather the info you are most interested in. Like with most weather related stuff, there is rarely just one button you can push to get all the info you want.
Text submitted by meteorologist Jim Woodmencey
Photos by Jim Woodmencey

Winter Weather Outlook 2012-13


With temps near 90 degrees the last two days in Jackson Hole it is hard to even think about snow and the coming Winter Season. But it happens every year in late August, the questions begin as to, “What kind of winter are we going to have?”
With the start of the Fall Season still three weeks away and Winter officially another three months beyond that, it seems silly to even start worrying about it while still in my shorts and flip-flops.
The reason the question gets raised this early in ski towns is because people are trying to make that decision of whether or not to buy a season ski pass, at the discounted rate, before the prices go up in September.
(Reminder: Prices increase Sept 1st for the Jackson Hole Mountain Resort. After Sept. 16th for Grand Targhee).
My standard answer to this annual question is, “It will be a great winter!”
After spending most of the last 30 of them here in Jackson Hole, I can tell you that a lean winter here still beats a good winter almost everywhere else! Sure, we’ve had our BIG winters that everyone would like to see repeated every winter (2010-11, for instance), but even when we have had lower snowfall winters, we’ve still had some tremendously great skiing.
So, let’s look at what the long range forecasts are saying for the upcoming Winter Season 2012-13.

Long Range Outlooks

A sneak peek at the Old Farmer’s Almanac, which comes out this week, tells a tale of warmer than normal temperatures for the Northwestern U.S. with below normal snowfall. They could be wrong, as they were way off on last winter’s prediction, after all.
The Climate Prediction Center (a division of NOAA and the National Weather Service) does show the start of the season, October-November- December with warmer than normal temps and “equal chances” for above or below normal snowfall.
(See maps below and keep up with all the latest short & long range outlooks on the
NWS Discussions Page
of mountainweather.com)
3-Month Outlook Maps for October-November-December 2012
Temperatures
Precipitation

El Nino Year

The fluctuation in the Equatorial Pacific that we commonly refer to as “El Nino & La Nina” is technically known as the “El Nino Southern Oscillation (ENSO)”. This is what the Climate Prediction Center focuses a lot of their time on when making these long range forecasts.
Last Winter (2011-12) we were also in a La Nina year, weaker than 2010-11’s, and the storm track went way north to Alaska most of the Winter & Spring of 2011-12. That is one of the things that can happen in some La Nina years. Or, it can get locked in over the Northwestern U.S. and Northern Rockies, like it did two winters ago, 2010-11, when winter didn’t end until June!
Most of the Summer of 2012 we have seen a “Neutral” condition with the ENSO, and now we are trending towards a weak to moderate El Ninocondition that is expected to persist for the Fall & Winter of 2012-13.
Usually, during El Nino winters, the storm track coming out of the Pacific favors a more southern route, and the Southwestern U.S. gets more precipitation. The opposite of a “normal” La Nina, where the Northwestern U.S. is favored and the Southwest is dry.
Don’t let that scare you, because statistically El Nino for us is a 50/50 proposition. Half of El Nino Winters in Jackson Hole produce below normal snowfall and half produce above normal snowfall.
The last time we had “weak” El Nino conditions was during the Winter of 2006-07, with below average snowfall. The last time we had moderate El Nino conditions was the Winter of 2009-10, and we saw above normal snowfall.
A 50/50 bet seems like decent odds to go ahead and buy that Season Pass!
 Chart below of ENSO Index 
(El Nino years in blue and La Nina Years in red.)


Text submitted by meteorologist Jim Woodmencey

Graphics from NOAA

Cool Cumulus Clouds

Late afternoon and early evening (between about 4:30 and 8:30 pm) on Friday July 27th there were some very cool looking cumulus clouds associated with thunderstorms around the Tetons & the Jackson Hole area.

Most of these would be classified as Cumulonimbus Mammatus Clouds. That is, they were of “cumulo-form” (tall & puffy)…… They produced some rain, so they also get the suffix “nimbo”…. And, they had the mammary shapes extending from their bases, thus “mammatus”.

Photo by Scott Guenther

The bulbous extensions beneath the clouds are indicative of strong updrafts and downdrafts within the thunderstorm. Whether or not the thunderstorm spits out rain or hail at that point depends on if the falling precipitation within the clouds can overcome the updraft speeds.

Below is a collection of photos sent to MountainWeather after the storm, and some that I captured while on a long hike through the Tetons that day, while on a patrol with some old Jenny Lake Ranger friends of mine.

Posted by meteorologist Jim Woodmencey


Looking West Towards Alaska Basin, Photo JW
Looking NW from near Static Peak Divide, Photo JW
Looking WNW from Static Peak Trail, Photo JW

Thunderstorms Add Needed Water

Downpours associated with thunderstorms that moved over Jackson Hole on Sunday produced about a half an inch of rain in town. That actually put us over the top for July’s precipitation and we are now above normal for the month, with another week or so to go.
Normal precipitation in town in July is 1.05 inches and so far this month we have received 1.23 inches. That goes a long way towards making up the deficit we have been in, and we are still below where we should be for the year so far, by a little over an inch of water (-1.13 inches). Especially after  below normal rainfall in May & June.
Looking at our total precipitation to date for the year (through July 22, 2012), we now stand at 8.21 inches of water. Historic average would be 9.34 inches for January through July.
Compare to Year’s Past
Back in 1988, the year of the Yellowstone Fires, we only had 6.99 inches for the year, through the end of July.
Looking back through the last 10 years or so, I found three other years that we had even less precipitation  than what we had in 1988, between January 1 and July 31. They were 2001, 2003 and 2007. Another thing to consider is that we just had three years in a row with above normal for precip at this point in the year. See table below.
Total Precip January 1 through July 31
Year
Precip Inches
2000
9.06
2001
5.54
2002
7.63
2003
6.57
2004
8.79
2005
10.15
2006
9.44
2007
4.92
2008
9.09
2009
13.93
2010
10.74
2011
12.82
2012 so far = 8.21 in.
Historic Average Jan.-July = 9.34 in.
Data in this table is taken from the Jackson Automated rain gauge, for comparison.
These current numbers are coming from an automated instrument near the site of the historic Jackson Climate Station, which was manually read by U.S. Forest Service employees up until February 2012, when they stopped taking manual readings. The historic numbers used for establishing our monthly averages were all read manually, for over 60 years.
Back to Those Thunderstorms

The thunderstorms went up the west side of the Tetons and directly over town Sunday did not distribute rainfall evenly in all locations.  The automated rain gauge near the old Jackson Climate Station recorded 0.48 inches. The Town of Jackson gauge at the County building showed 0.50 inches. And the automated gauge at the Driggs, Idaho Airport showed 0.52 inches of water.
Grand Teton National park gauges recorded only around 0.10 inches, and even all the way up to Old Faithful, just 0.13 inches. All much less than in town.
Drought or no Drought
The current U.S. Drought Monitor Map shows that most of Wyoming is in a “moderate” to “extreme” drought, while Northwest Wyoming, including Teton County is “abnormally dry”. Areas of southern Wyoming, especially between Rock Springs & Rawlins have some of the worst conditions. See map below.

In a relative sense, we aren’t so bad off here in Northwest Wyoming, all one has to do is look around and we still have some pretty green hillsides. Not too many other places in Wyoming have that going for them right now.
Text & Analysis by meteorologist Jim Woodmencey
Map from NOAA

July 11, 2012 Thunderstorm Summary

A large thunderstorm cell developed over Southeastern Idaho late Wednesday morning (July 11, 2012) and drifted slowly east over Northwestern Wyoming at around noontime. This thunderstorm cell grew to roughly the size of Teton County,WY and produced a fair amount of lightning as it moved overhead.
The images below are from the height of that thunderstorm as it was moving over Jackson Hole & the Tetons, with the heaviest concentration of lightning was across the southern part of Jackson Hole. One of those bolts that hit the top of Snow King managed to fry one of the components in the computer that runs the lightning detector, hopefully that will get repaired in the next day or so. (You can access this via the Lightning Map Page on mountainweather.com).
Lightning Image is a bit complicated to explain, but you get the idea, there was a fair amount of lightning. Red & orange dots are bolts hitting the ground, green & yellow rings are the instrument trying to discern parts of the thunderstorm that are producing the most lightning strikes. Instrument also can detect in-cloud lightning, depicted by blue plus/minus symbols.
Snow King Lightning Detector Image
(From MountainWeather )
Pocatello Radar Image
(Courtesy of NWS)
Infra-Red Satellite Photo (NOAA)
Visible Satellite Photo (NOAA)
Radar image & Satellite photos also show the aerial extent of this thunderstorm very well. These images are all taken from very close to the noon hour.
This was a slow moving thunderstorm, due to very light winds aloft, which contributed to its ability to produce a large amount of lightning over a concentrated area. Some gusty winds were produced in some places and there was a downpour of rain in other places, beneath this thunderstorm.

Weather Observations

Wind Gusts: In the valley winds gusted up to 31 mph at Timbered Island weather station in Grand Teton National Park. Unfortunately, the Town of Jackson instrument was down during this event, so no data was available from there.
In the mountains at the Raymer wind station near 9500-ft. at the Jackson Hole Mountain Resort recorded a wind gust of 45 mph at around 12:15 pm. At the same time on the Lower Saddle of the Grand Teton at 11,600-ft. there was a wind gust of 52 mph.
Rain: Phillips Bench Snotel had 0.10 inches of rain, the USFS instrument in Jackson had 0.11 inches. Areas north of Town in Teton Park and over in Driggs, ID only reported a trace of precipitation. The Raymer precip gauge at around 9300-ft. showed 0.08 inches.
Keep in mind that anytime you hear “thunderstorms” in the forecast, that should imply the potential for gusty downdraft winds, and/or brief downpours of rain, and of course, lightning!
Post by meteorologist Jim Woodmencey
Graphics from MountainWeather & NOAA

June 2012 Weather Review

To no one’s surprise, June 2012 was warm & dry. It was not the hottest June ever by any means, but it was certainly one of the driest on record. I will review temperatures first and then the precipitation, or lack thereof!

Temperatures
The average high temperature in the Town of Jackson during June 2012 was 75 degrees, or about 3 degrees warmer than normal. The average low temperature was 38 degrees, and only about 1 degree warmer than normal.
That would make for an average “mean” temperature for the month of 56.5 degrees, which is about 2 degrees warmer than the historic average for June.
Although we had 10 days in June that were 80 degrees or warmer, we also had a number of days that were well below normal, with highs only in the 50’s. That certainly prevented June 2012 from being ranked among the hottest. There were many other years, especially in the 1990’s and early 2000’s that experienced warmer Junes. None of those were able to top the warmest June ever, which was June 1988. The average mean temperature back then was 61.4°F.
Precipitation
You would have to go all the way back to 1935 to find a drier June in Jackson Hole, when only 0.17 inches of rainfall was recorded. This June we had 0.20 inches.
Even June of 1988 saw more precip, with 0.35 inches of rainfall for the month. But that summer went on to be the hottest & driest on record, with no precip in the entire month of July and a scant 0.45 inches in the month of August.
That 0.20 inches this June was way below our normal June precip of 1.65 inches, by almost am inch and a half!
June 2012          vs.      June Historic Averages
Avg. High Temp = 75°F
Normal High = 72°F
Avg. Low Temp = 38°F
Normal Low = 37°F
Avg. Mean Temp = 56.5°F
Normal Mean = 54.5°F
Total Precip.= 0.20 inches
Normal Precip = 1.65 inches
Look Ahead to July
The latest 30-day Outlook for July indicates above normal temperatures and equal chances of above or below normal precipitation (see maps below). The Pacific Northwest is expected to be below normal and areas to the south of us, like the southern and central Rockies, are expected to see above normal precip. That will likely be due to an active monsoon season, which is beginning this week. (See blog post from last summer about the Monsoon).
For more info about long range weather forecasts, click here and go to the bottom of the  : MountainWeather.com Outlooks Page
http://www.cpc.ncep.noaa.gov/products/predictions/30day/off15_temp.gif
July 2012 Temperature Outlook
July 2012 Precipitation Outlook
Text by meteorologist Jim Woodmencey
Graphics from NWS
Data for June 2012 is from the USFS “automated” weather station, and is compared to the old historical record which was all taken “manually for the last 70+ years.

Fire Weather Season

June is shaping up much like it did back in the Summer of 1988, with hot, dry, and windy weather rapidly escalating the fire danger. Big, rapidly growing fires this season already in Colorado, Utah, and Southwestern Wyoming should be all the reminder we need to be extra careful this Fourth of July Week. (See link to big fire map below). You can follow the progress of this fire season and these big fires by clicking on this link to:
The U.S. Forest Service’s Active Fire Page


Jackson Hole has been spared so far, with no thunderstorms this past week to spark any fires. We’ve been sitting under a dry & stable Southwesterly flow. But the weather not too far to the south of us over eastern Utah & western Colorado has had a few thunderstorms as a relatively narrow tongue of moisture in the upper levels of the atmosphere has extended from Arizona, northward to parts of southern Wyoming.

Upper Level Map at 500mb (@18,000-ft.
To the West of us, the Pacific Northwest has seen some very cool & wet weather as a series of Low pressure systems has hung along the Coast and then taken a track inland that keep the precipitation to the North & West of Wyoming.

Some indication that the weather pattern may change by the middle or end of next week, with what looks like some monsoon moisture creeping up from the South, which would likely bring us some thunderstorms. 


Posted by meteorologist Jim Woodmencey
Map images from USFS & UCAR