All posts by Jim Woodmencey
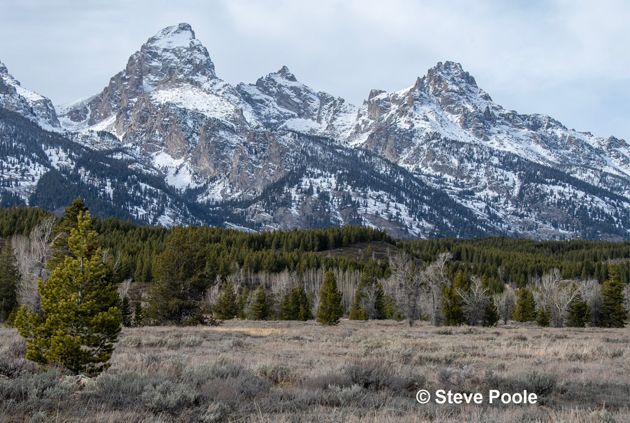
Fall in the Tetons
Winter 2023-24 Outlook is quite varied
Almost as soon as October rolls around, I start getting hit with the same perennial questions: “When is it going to start snowing?”, and “What kind of winter are we going to have?”
I don’t particularly like winter to start too early, summers are way too short here in Jackson Hole, and I usually welcome any extension of summer-like weather into the early fall. Last year snowfall began in town on October 24th, 2022 and it kept coming. The Winter of 2022-23 then went on to be a record-breaking snowfall winter for the mountains.
This year, the first snowfall wit accumulation in the Town of Jackson was on October 26th, 2023. The big question is: Will we see a repeat of last winter’s well above normal snowfall and well below normal temperatures? The answer lies somewhere within all the predictions, which I will outline for you in this week’s column.
NOAA’s Outlook
Let’s start with latest the long-range outlook from NOAA’s Climate Prediction Center, issued in October 19, 2023.
For December 2023 through February 2024 temperatures are predicted to be above normal across the northern tier of the United States. In Northwest Wyoming chances of a warmer winter are in the 33 to 40% chance category, that is, they are just barely leaning towards warmer for us.
Precipitation for the three-month period is expected to be above normal across the southern tier of the United States, and below normal across much of the northern tier of the U.S. In Northwest Wyoming, NOAA has us again at a 33 to 40 percent chance of seeing below normal precipitation this winter, and very close to the edge of a 40 to 50 percent chance of below normal. A rather bleak outlook for snow enthusiasts.
California and the central Rockies right now look to at least have some chance of above normal precipitation this winter.
ENSO Forecast
As you may have heard, El Nino is back, and NOAA is predicting a 95 percent chance that this El Nino will continue through March of 2024. They are now predicting a 75 to 85 percent chance that it will become a strong El Nino.
According to NOAA: “A strong event doesn’t guarantee strong global impacts, but it does increase the odds that some level of impacts will occur in places with a history of being affected by ENSO.”
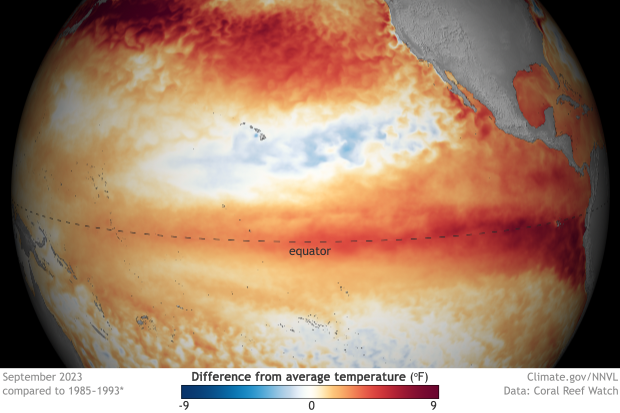
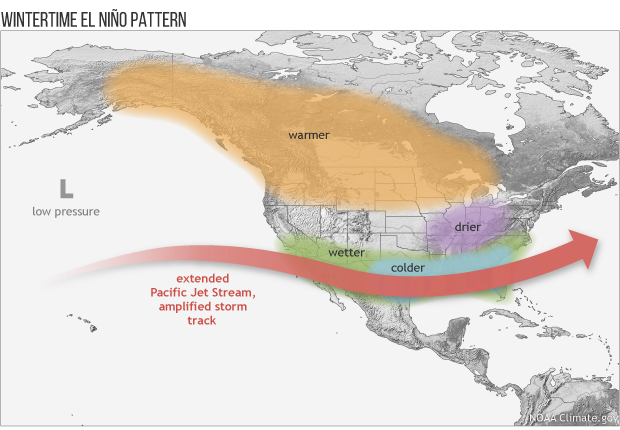
El Nino is one phase of ENSO, the El Nino Southern Oscillation. An El Nino condition is when sea surface temperatures in the Equatorial Pacific are warmer than normal. A La Nina occurs when those temperatures are colder than normal, which is the condition we had for the previous three winters. Both El Nino and La Nina have some effect on the weather patterns that develop, primarily across the Pacific Ocean during the Northern Hemisphere’s winter season.
Typically, an El Nino condition will favor more precipitation, and more snow, over the Sierras in California and across the Southwestern U.S., while the northern tier of the U.S. is generally drier in an El Nino winter.
El Nino winters are not known for producing big winters in Jackson Hole. Looking back at the 13 El Nino winters we have had since 1975, only three of those produced above average snowfall in the mountains, and barely. The rest were all below average snowfall winters here.
NOAA’s long-range outlook for the United States seems to align closely with what a typical El Nino winter would produce.
OK, that was the bad news. Now on to the good news.
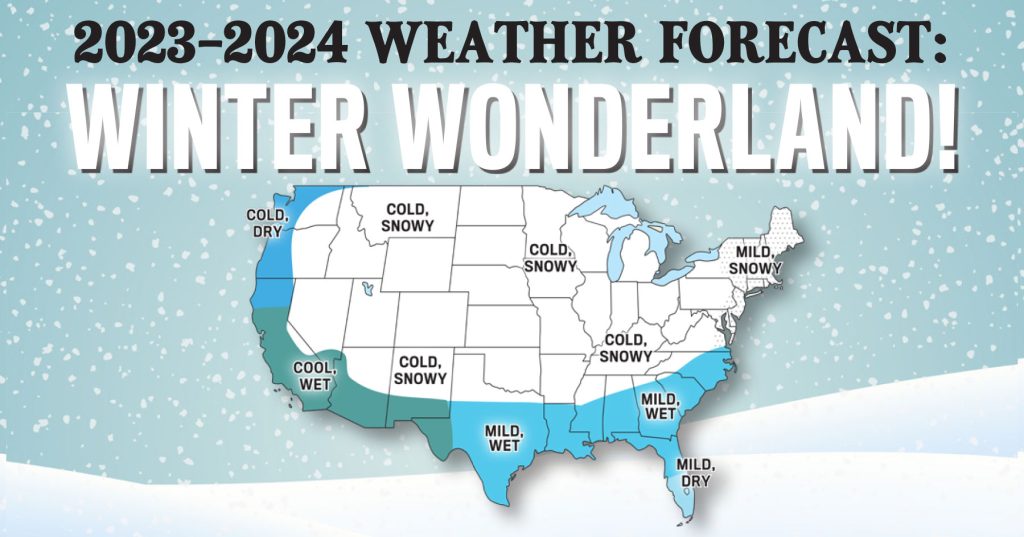
Farmers Almanacs
The map inside the 2024 Old Farmer’s Almanac shows that almost the entire country is predicted to experience a cold and snowy winter, including Northwest Wyoming. The Pacific Northwest Coast is showing cold and dry, at the opposite end of the country Southern Florida is showing mild and dry. The Southwestern U.S. is supposed to be cool and wet, the Southeast is listed as mild and wet, and the Northeast is depicted as mild and snowy.
The 2024 Farmer’s Almanac, that other almanac, is very similar to the Old Farmer’s forecast. It shows most of the country as wet and cold. The Rockies, including all of Wyoming, is described as cold with average snowfall. As their slogan on their map says for this winter, “the BRRR is Back!”.
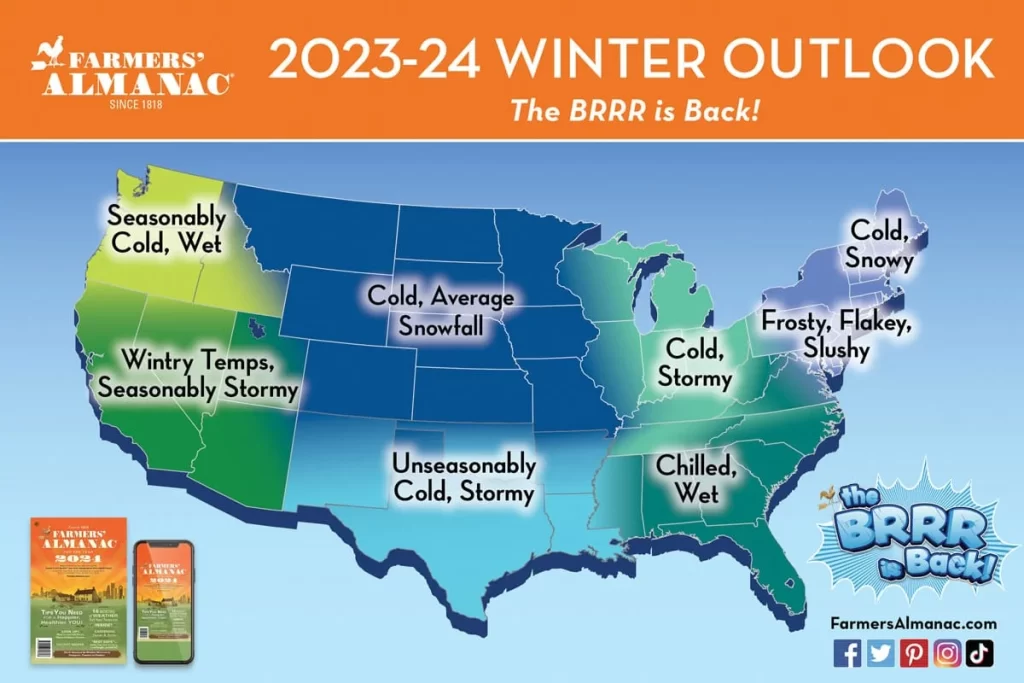
Those are radically different pictures than the one NOAA has painted!
Other Indicators
As I mentioned in this column last fall when I gave the predictions for the coming winter, there are a few other things I pay attention to in nature that might portend what kind of winter we are going to have. First are the wooly worms, when they are all black in color, a snowy winter is in store, when they are browner or are striped with brown and black, there tends to be less snow. Last fall they were all black, this fall I have seen more brown than black ones.
The second indicator would be the raspberry crop. My neighbor has a bunch of raspberry bushes, and he says this year’s crop was healthy, but not as prolific as last year. Bumper crops of raspberries seem to equate to more snow.
The third indicator is the number of pinecones the squirrels are tossing out of the trees. Last fall, they were throwing down copious amounts of cones onto my roof and into my yard up on Snow King. So far this fall, the squirrels have been a little less aggressive storing up nuts for the winter.
From those indicators I would say the chances of seeing a repeat of last winter’s record snowfall are not high. The wildcard then becomes the competing predictions from NOAA versus the Almanacs. NOAA basically says warm and dry for us, while both Almanacs say cold and snowy.
I suppose we’ll have to wait until April to see who was right. Or perhaps we’ll land somewhere in the middle.
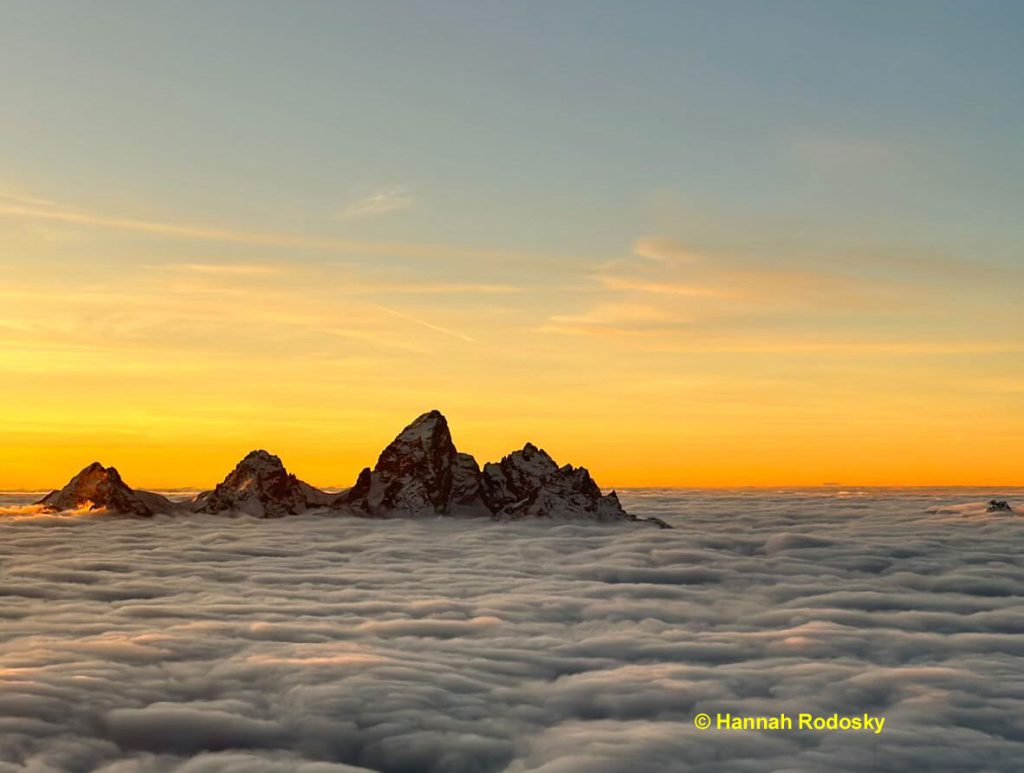
Jackson Sunrise
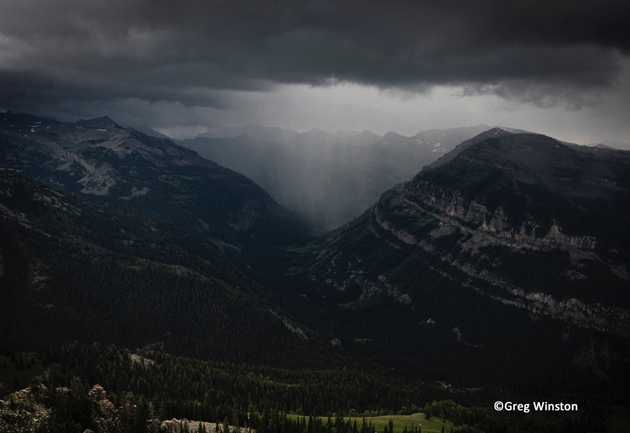
North Fork Cascade Canyon
Mount Rainier Cloud
Hermitage Point GTNP
Open Canyon
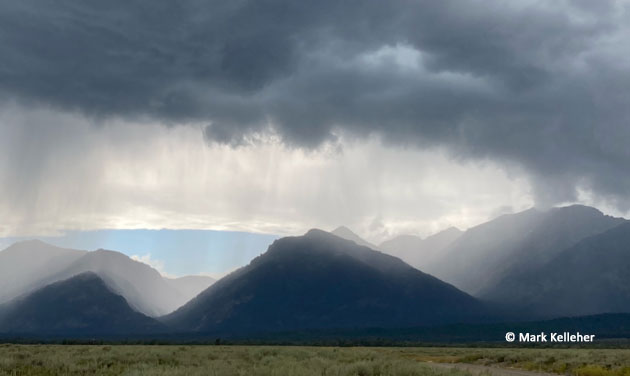
Monsoon Rains in the Tetons
Weather History of Jackson Hole
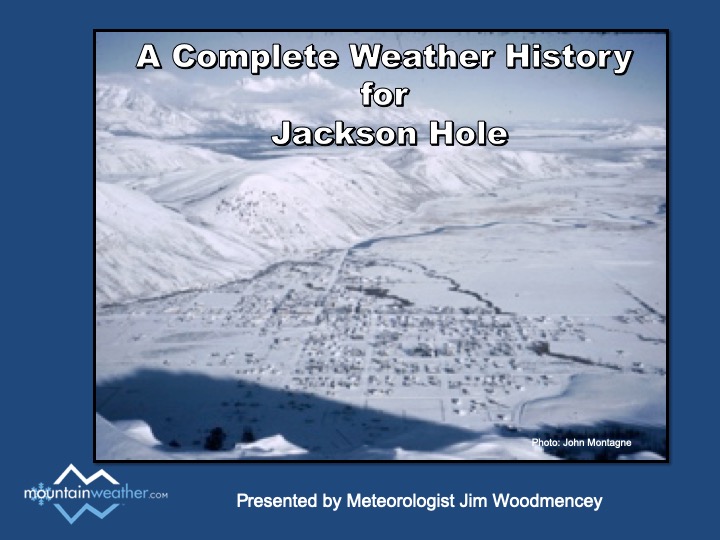
Click on the image to view the You Tube video of this presentation by meteorologist Jim Woodmencey for the Geologists of Jackson Hole in February of 2023.
Introduction:
Meteorologist Jim Woodmencey has lived and worked in Jackson Hole since 1982 and has forecast, studied, and written about Jackson Hole’s weather for over 30 years.
This presentation explores Jackson Hole’s weather history, beginning with when the earliest weather observations began, to where our local climate stations are located. It will also discuss how those observations are recorded and what has changed over the years, both in instrumentation and station location.
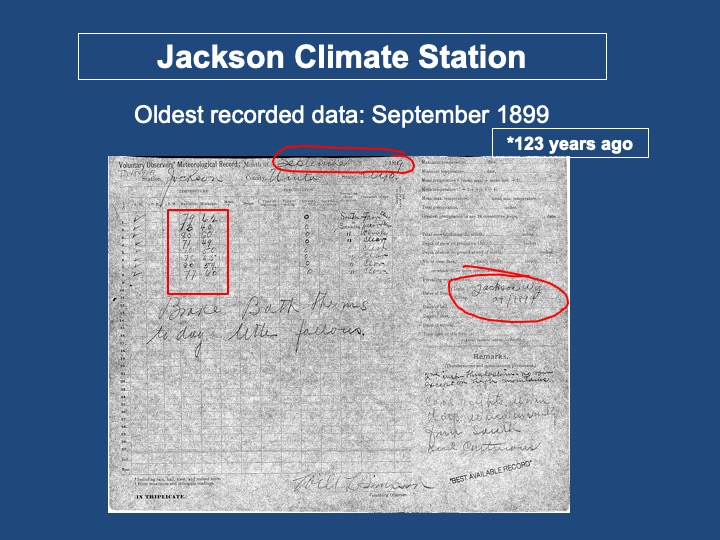
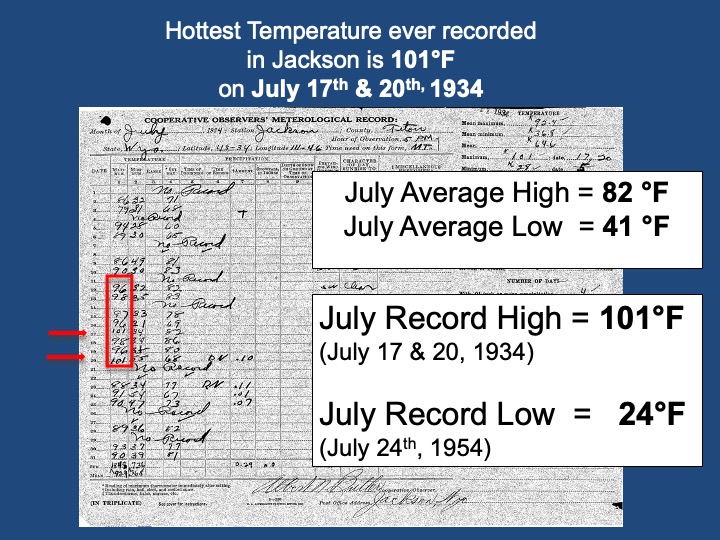
From all the available weather data, spanning about 100 years, we can construct a historical picture of the averages and the extremes of weather that have occurred in the Jackson Hole Valley. What were the hottest and coldest temperatures ever recorded? When was it wettest or driest? What were the biggest storms and the biggest snowfalls?
The distinction will be made between what is weather and what is climate and how they are connected. It is from all the daily weather observations that are recorded over time that we establish our averages, or what we consider to be “normal” conditions. It is those averages by which we judge the trends in our local climate.
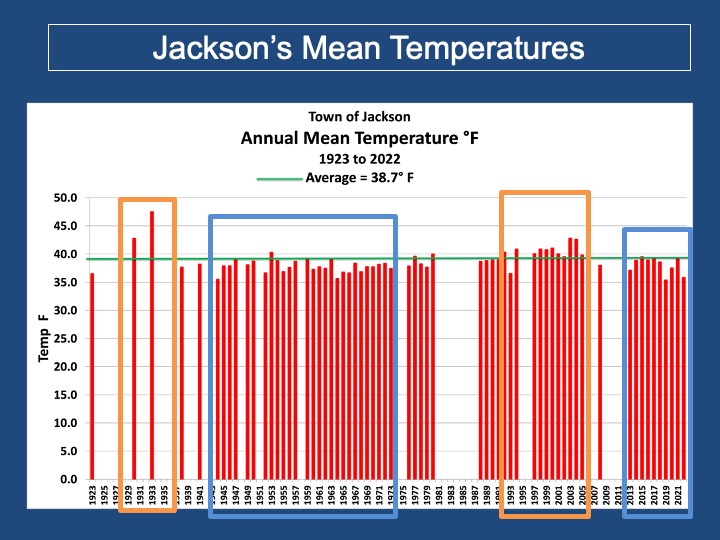
A complete picture of Jackson’s entire weather history is presented along with the current trends in temperature, precipitation, and snowfall. So, if you lived in Jackson Hole for a lifetime or just a few years, this presentation should provide you with a more comprehensive perspective on both the weather and climate of this unique location.